Enhanced Scalping IndicatorEnhanced Scalping Indicator - Professional Multi-Confirmation Trading System
Overview
The Enhanced Scalping Indicator is a sophisticated trading tool designed for short-term traders seeking high-probability entry and exit signals. This indicator combines multiple technical analysis techniques with adaptive market conditions to filter noise and identify optimal trading opportunities.
Key Features
🎯 Multi-Confirmation Signal System
- Enhanced RSI with Adaptive Thresholds: Dynamic overbought/oversold levels that adjust based on market volatility (ATR)
- Higher Timeframe Confirmation: Uses 1-hour RSI to validate signals from lower timeframes
- Volume-Weighted Momentum: Incorporates volume analysis to confirm price movements
- Market Structure Analysis: Evaluates price position within recent 20-bar range
📊 Advanced Signal Generation
- Buy Signals: Triggered when RSI is oversold with upward momentum, confirmed by higher timeframe bearish conditions and strong volume
- Sell Signals: Activated when RSI is overbought with downward momentum, validated by higher timeframe bullish conditions and high volume
- Exit Signals: Smart exit conditions based on RSI mean reversion and momentum shifts
🔄 Divergence Detection (Optional)
- Bullish Divergence: Identifies when price makes lower lows while RSI makes higher lows
- Bearish Divergence: Spots when price makes higher highs while RSI makes lower highs
- Volume Confirmation: All divergence signals require above-average volume for validation
⚙️ Customizable Parameters
- RSI Settings: Adjustable length (default: 14) and source
- Moving Average Options: Choose from SMA, EMA, SMMA, WMA, VWMA, or Bollinger Bands
- Higher Timeframe: Configurable confirmation timeframe (default: 1 hour)
- ATR Period: [
/b] Volatility measurement period for adaptive thresholds
📈 Visual Elements
- Dynamic Threshold Lines: Adaptive overbought/oversold levels
- Signal Shapes: Clear buy/sell and exit signals on chart
- Background Highlighting: Color-coded background for active signals
- Real-time Information Table: Displays current RSI, higher timeframe RSI, volatility ratio, market position, and momentum
🚨 Alert System
Complete alert functionality for:
- Enhanced buy signals
- Enhanced sell signals
- Long position exits
- Short position exits
Best Use Cases
- Scalping: 1-5 minute timeframes for quick trades
- Day Trading: 15-30 minute timeframes for intraday positions
- Swing Trading: Higher timeframes with divergence detection enabled
Market Conditions
Works effectively in:
- T rending Markets: Momentum and higher timeframe filters reduce false signals
- Range-bound Markets: Adaptive thresholds adjust to market volatility
- High Volume Sessions: Built-in volume filters ensure signal quality
Strategy Integration
This indicator works well with:
- Support/resistance levels
- Price action analysis
- Risk management rules (stop losses, position sizing)
- Market session awareness (built-in US market hours filter)
Technical Implementation
- Built on Pine Script v6
- Utilizes proper RMA calculations for RSI
- Implements consistent historical data access
- Optimized for performance with minimal repainting
Risk Disclaimer
This indicator is a technical analysis tool and should not be used as the sole basis for trading decisions. Always combine with proper risk management, fundamental analysis, and your trading strategy. Past performance does not guarantee future results.
---
Perfect for: Scalpers, day traders, and swing traders looking for a comprehensive, multi-confirmation trading system with built-in risk management features.
Cari dalam skrip untuk "swing trading"

Enhanced Stock Ticker with 50MA vs 200MADescription
The Enhanced Stock Ticker with 50MA vs 200MA is a versatile Pine Script indicator designed to visualize the relative position of a stock's price within its short-term and long-term price ranges, providing actionable bullish and bearish signals. By calculating normalized indices based on user-defined lookback periods (defaulting to 50 and 200 bars), this indicator helps traders identify potential reversals or trend continuations. It offers the flexibility to plot signals either on the main price chart or in a separate lower pane, leveraging Pine Script v6's force_overlay functionality for seamless integration. The indicator also includes a customizable ticker table, visual fills, and alert conditions for automated trading setups.
Key Features
Dual Lookback Indices: Computes short-term (default: 50 bars) and long-term (default: 200 bars) indices, normalizing the closing price relative to the high/low range over the specified periods.
Flexible Signal Plotting: Users can toggle between plotting crossover signals (triangles) on the main price chart (location.abovebar/belowbar) or in the lower pane (location.top/bottom) using the Plot Signals on Main Chart option.
Crossover Signals: Generates bullish (Golden Cross) and bearish (Death Cross) signals when the short or long index crosses above 5 or below 95, respectively.
Visual Enhancements:
Plots short-term (blue) and long-term (white) indices in a separate pane with customizable lookback periods.
Includes horizontal reference lines at 0, 20, 50, 80, and 100, with green and red fills to highlight overbought/oversold zones.
Dynamic fill between indices (green when short > long, red when long > short) for quick trend visualization.
Displays a ticker and legend table in the top-right corner, showing the symbol and lookback periods.
Alert Conditions: Supports alerts for bullish and bearish crossovers on both short and long indices, enabling integration with TradingView's alert system.
Technical Innovation: Utilizes Pine Script v6's force_overlay parameter to plot signals on the main chart from a non-overlay indicator, combining the benefits of a separate pane and chart-based signals in a single script.
Technical Details
Calculation Logic:
Uses confirmed bars (barstate.isconfirmed) to calculate indices, ensuring reliability by avoiding real-time bar fluctuations.
Short-term index: (close - lowest(low, lookback_short)) / (highest(high, lookback_short) - lowest(low, lookback_short)) * 100
Long-term index: (close - lowest(low, lookback_long)) / (highest(high, lookback_long) - lowest(low, lookback_long)) * 100
Signals are triggered using ta.crossover() and ta.crossunder() for indices crossing 5 (bullish) and 95 (bearish).
Signal Plotting:
Main chart signals use force_overlay=true with location.abovebar/belowbar for precise alignment with price bars.
Lower pane signals use location.top/bottom for visibility within the indicator pane.
Plotting is controlled by boolean conditions (e.g., bullishLong and plot_on_chart) to ensure compliance with Pine Script's global scope requirements.
Performance Considerations: Optimized for efficiency by calculating indices only on confirmed bars and using lightweight plotting functions.
How to Use
Add to Chart:
Copy the script into TradingView's Pine Editor and add it to your chart.
Configure Settings:
Short Lookback Period: Adjust the short-term lookback (default: 50 bars) to match your trading style (e.g., 20 for shorter-term analysis).
Long Lookback Period: Adjust the long-term lookback (default: 200 bars) for broader market context.
Plot Signals on Main Chart: Check this box to display signals on the price chart; uncheck to show signals in the lower pane.
Interpret Signals:
Golden Cross (Bullish): Green (long) or blue (short) triangles indicate the index crossing above 5, suggesting a potential buying opportunity.
Death Cross (Bearish): Red (long) or white (short) triangles indicate the index crossing below 95, signaling a potential selling opportunity.
Set Alerts:
Use TradingView's alert system to create notifications for the four alert conditions: Long Index Valley, Long Index Peak, Short Index Valley, and Short Index Peak.
Customize Visuals:
The ticker table displays the symbol and lookback periods in the top-right corner.
Adjust colors and styles via TradingView's settings if desired.
Example Use Cases
Swing Trading: Use the short-term index (e.g., 50 bars) to identify short-term reversals within a broader trend defined by the long-term index.
Trend Confirmation: Monitor the fill between indices to confirm whether the short-term trend aligns with the long-term trend.
Automated Trading: Leverage alert conditions to integrate with bots or manual trading strategies.
Notes
Testing: Always backtest the indicator on your chosen market and timeframe to validate its effectiveness.
Optional Histogram: The script includes a commented-out histogram for the index difference (index_short - index_long). Uncomment the plot(index_diff, ...) line to enable it.
Compatibility: Built for Pine Script v6 and tested on TradingView as of May 27, 2025.
Acknowledgments
This indicator was inspired by the need for a flexible tool that combines lower-pane analysis with main chart signals, made possible by Pine Script's force_overlay feature. Share your feedback or suggestions in the comments below, and happy trading!

Ergodic Market Divergence (EMD)Ergodic Market Divergence (EMD)
Bridging Statistical Physics and Market Dynamics Through Ensemble Analysis
The Revolutionary Concept: When Physics Meets Trading
After months of research into ergodic theory—a fundamental principle in statistical mechanics—I've developed a trading system that identifies when markets transition between predictable and unpredictable states. This indicator doesn't just follow price; it analyzes whether current market behavior will persist or revert, giving traders a scientific edge in timing entries and exits.
The Core Innovation: Ergodic Theory Applied to Markets
What Makes Markets Ergodic or Non-Ergodic?
In statistical physics, ergodicity determines whether a system's future resembles its past. Applied to trading:
Ergodic Markets (Mean-Reverting)
- Time averages equal ensemble averages
- Historical patterns repeat reliably
- Price oscillates around equilibrium
- Traditional indicators work well
Non-Ergodic Markets (Trending)
- Path dependency dominates
- History doesn't predict future
- Price creates new equilibrium levels
- Momentum strategies excel
The Mathematical Framework
The Ergodic Score combines three critical divergences:
Ergodic Score = (Price Divergence × Market Stress + Return Divergence × 1000 + Volatility Divergence × 50) / 3
Where:
Price Divergence: How far current price deviates from market consensus
Return Divergence: Momentum differential between instrument and market
Volatility Divergence: Volatility regime misalignment
Market Stress: Adaptive multiplier based on current conditions
The Ensemble Analysis Revolution
Beyond Single-Instrument Analysis
Traditional indicators analyze one chart in isolation. EMD monitors multiple correlated markets simultaneously (SPY, QQQ, IWM, DIA) to detect systemic regime changes. This ensemble approach:
Reveals Hidden Divergences: Individual stocks may diverge from market consensus before major moves
Filters False Signals: Requires broader market confirmation
Identifies Regime Shifts: Detects when entire market structure changes
Provides Context: Shows if moves are isolated or systemic
Dynamic Threshold Adaptation
Unlike fixed-threshold systems, EMD's boundaries evolve with market conditions:
Base Threshold = SMA(Ergodic Score, Lookback × 3)
Adaptive Component = StDev(Ergodic Score, Lookback × 2) × Sensitivity
Final Threshold = Smoothed(Base + Adaptive)
This creates context-aware signals that remain effective across different market environments.
The Confidence Engine: Know Your Signal Quality
Multi-Factor Confidence Scoring
Every signal receives a confidence score based on:
Signal Clarity (0-35%): How decisively the ergodic threshold is crossed
Momentum Strength (0-25%): Rate of ergodic change
Volatility Alignment (0-20%): Whether volatility supports the signal
Market Quality (0-20%): Price convergence and path dependency factors
Real-Time Confidence Updates
The Live Confidence metric continuously updates, showing:
- Current opportunity quality
- Market state clarity
- Historical performance influence
- Signal recency boost
- Visual Intelligence System
Adaptive Ergodic Field Bands
Dynamic bands that expand and contract based on market state:
Primary Color: Ergodic state (mean-reverting)
Danger Color: Non-ergodic state (trending)
Band Width: Expected price movement range
Squeeze Indicators: Volatility compression warnings
Quantum Wave Ribbons
Triple EMA system (8, 21, 55) revealing market flow:
Compressed Ribbons: Consolidation imminent
Expanding Ribbons: Directional move developing
Color Coding: Matches current ergodic state
Phase Transition Signals
Clear entry/exit markers at regime changes:
Bull Signals: Ergodic restoration (mean reversion opportunity)
Bear Signals: Ergodic break (trend following opportunity)
Confidence Labels: Percentage showing signal quality
Visual Intensity: Stronger signals = deeper colors
Professional Dashboard Suite
Main Analytics Panel (Top Right)
Market State Monitor
- Current regime (Ergodic/Non-Ergodic)
- Ergodic score with threshold
- Path dependency strength
- Quantum coherence percentage
Divergence Metrics
- Price divergence with severity
- Volatility regime classification
- Strategy mode recommendation
- Signal strength indicator
Live Intelligence
- Real-time confidence score
- Color-coded risk levels
- Dynamic strategy suggestions
Performance Tracking (Left Panel)
Signal Analytics
- Total historical signals
- Win rate with W/L breakdown
- Current streak tracking
- Closed trade counter
Regime Analysis
- Current market behavior
- Bars since last signal
- Recommended actions
- Average confidence trends
Strategy Command Center (Bottom Right)
Adaptive Recommendations
- Active strategy mode
- Primary approach (mean reversion/momentum)
- Suggested indicators ("weapons")
- Entry/exit methodology
- Risk management guidance
- Comprehensive Input Guide
Core Algorithm Parameters
Analysis Period (10-100 bars)
Scalping (10-15): Ultra-responsive, more signals, higher noise
Day Trading (20-30): Balanced sensitivity and stability
Swing Trading (40-100): Smooth signals, major moves only Default: 20 - optimal for most timeframes
Divergence Threshold (0.5-5.0)
Hair Trigger (0.5-1.0): Catches every wiggle, many false signals
Balanced (1.5-2.5): Good signal-to-noise ratio
Conservative (3.0-5.0): Only extreme divergences Default: 1.5 - best risk/reward balance
Path Memory (20-200 bars)
Short Memory (20-50): Recent behavior focus, quick adaptation
Medium Memory (50-100): Balanced historical context
Long Memory (100-200): Emphasizes established patterns Default: 50 - captures sufficient history without lag
Signal Spacing (5-50 bars)
Aggressive (5-10): Allows rapid-fire signals
Normal (15-25): Prevents clustering, maintains flow
Conservative (30-50): Major setups only Default: 15 - optimal trade frequency
Ensemble Configuration
Select markets for consensus analysis:
SPY: Broad market sentiment
QQQ: Technology leadership
IWM: Small-cap risk appetite
DIA: Blue-chip stability
More instruments = stronger consensus but potentially diluted signals
Visual Customization
Color Themes (6 professional options):
Quantum: Cyan/Pink - Modern trading aesthetic
Matrix: Green/Red - Classic terminal look
Heat: Blue/Red - Temperature metaphor
Neon: Cyan/Magenta - High contrast
Ocean: Turquoise/Coral - Calming palette
Sunset: Red-orange/Teal - Warm gradients
Display Controls:
- Toggle each visual component
- Adjust transparency levels
- Scale dashboard text
- Show/hide confidence scores
- Trading Strategies by Market State
- Ergodic State Strategy (Primary Color Bands)
Market Characteristics
- Price oscillates predictably
- Support/resistance hold
- Volume patterns repeat
- Mean reversion dominates
Optimal Approach
Entry: Fade moves at band extremes
Target: Middle band (equilibrium)
Stop: Just beyond outer bands
Size: Full confidence-based position
Recommended Tools
- RSI for oversold/overbought
- Bollinger Bands for extremes
- Volume profile for levels
- Non-Ergodic State Strategy (Danger Color Bands)
Market Characteristics
- Price trends persistently
- Levels break decisively
- Volume confirms direction
- Momentum accelerates
Optimal Approach
Entry: Breakout from bands
Target: Trail with expanding bands
Stop: Inside opposite band
Size: Scale in with trend
Recommended Tools
- Moving average alignment
- ADX for trend strength
- MACD for momentum
- Advanced Features Explained
Quantum Coherence Metric
Measures phase alignment between individual and ensemble behavior:
80-100%: Perfect sync - strong mean reversion setup
50-80%: Moderate alignment - mixed signals
0-50%: Decoherence - trending behavior likely
Path Dependency Analysis
Quantifies how much history influences current price:
Low (<30%): Technical patterns reliable
Medium (30-50%): Mixed influences
High (>50%): Fundamental shift occurring
Volatility Regime Classification
Contextualizes current volatility:
Normal: Standard strategies apply
Elevated: Widen stops, reduce size
Extreme: Defensive mode required
Signal Strength Indicator
Real-time opportunity quality:
- Distance from threshold
- Momentum acceleration
- Cross-validation factors
Risk Management Framework
Position Sizing by Confidence
90%+ confidence = 100% position size
70-90% confidence = 75% position size
50-70% confidence = 50% position size
<50% confidence = 25% or skip
Dynamic Stop Placement
Ergodic State: ATR × 1.0 from entry
Non-Ergodic State: ATR × 2.0 from entry
Volatility Adjustment: Multiply by current regime
Multi-Timeframe Alignment
- Check higher timeframe regime
- Confirm ensemble consensus
- Verify volume participation
- Align with major levels
What Makes EMD Unique
Original Contributions
First Ergodic Theory Trading Application: Transforms abstract physics into practical signals
Ensemble Market Analysis: Revolutionary multi-market divergence system
Adaptive Confidence Engine: Institutional-grade signal quality metrics
Quantum Coherence: Novel market alignment measurement
Smart Signal Management: Prevents clustering while maintaining responsiveness
Technical Innovations
Dynamic Threshold Adaptation: Self-adjusting sensitivity
Path Memory Integration: Historical dependency weighting
Stress-Adjusted Scoring: Market condition normalization
Real-Time Performance Tracking: Built-in strategy analytics
Optimization Guidelines
By Timeframe
Scalping (1-5 min)
Period: 10-15
Threshold: 0.5-1.0
Memory: 20-30
Spacing: 5-10
Day Trading (5-60 min)
Period: 20-30
Threshold: 1.5-2.5
Memory: 40-60
Spacing: 15-20
Swing Trading (1H-1D)
Period: 40-60
Threshold: 2.0-3.0
Memory: 80-120
Spacing: 25-35
Position Trading (1D-1W)
Period: 60-100
Threshold: 3.0-5.0
Memory: 100-200
Spacing: 40-50
By Market Condition
Trending Markets
- Increase threshold
- Extend memory
- Focus on breaks
Ranging Markets
- Decrease threshold
- Shorten memory
- Focus on restores
Volatile Markets
- Increase spacing
- Raise confidence requirement
- Reduce position size
- Integration with Other Analysis
- Complementary Indicators
For Ergodic States
- RSI divergences
- Bollinger Band squeezes
- Volume profile nodes
- Support/resistance levels
For Non-Ergodic States
- Moving average ribbons
- Trend strength indicators
- Momentum oscillators
- Breakout patterns
- Fundamental Alignment
- Check economic calendar
- Monitor sector rotation
- Consider market themes
- Evaluate risk sentiment
Troubleshooting Guide
Too Many Signals:
- Increase threshold
- Extend signal spacing
- Raise confidence minimum
Missing Opportunities
- Decrease threshold
- Reduce signal spacing
- Check ensemble settings
Poor Win Rate
- Verify timeframe alignment
- Confirm volume participation
- Review risk management
Disclaimer
This indicator is for educational and informational purposes only. It does not constitute financial advice. Trading involves substantial risk of loss and is not suitable for all investors. Past performance does not guarantee future results.
The ergodic framework provides unique market insights but cannot predict future price movements with certainty. Always use proper risk management, conduct your own analysis, and never risk more than you can afford to lose.
This tool should complement, not replace, comprehensive trading strategies and sound judgment. Markets remain inherently unpredictable despite advanced analysis techniques.
Transform market chaos into trading clarity with Ergodic Market Divergence.
Created with passion for the TradingView community
Trade with insight. Trade with anticipation.
— Dskyz , for DAFE Trading Systems

Auto AI Trendlines [TradingFinder] Clustering & Filtering Trends🔵 Introduction
Auto AI trendlines Clustering & Filtering Trends Indicator, draws a variety of trendlines. This auto plotting trendline indicator plots precise trendlines and regression lines, capturing trend dynamics.
Trendline trading is the strongest strategy in the financial market.
Regression lines, unlike trendlines, use statistical fitting to smooth price data, revealing trend slopes. Trendlines connect confirmed pivots, ensuring structural accuracy. Regression lines adapt dynamically.
The indicator’s ascending trendlines mark bullish pivots, while descending ones signal bearish trends. Regression lines extend in steps, reflecting momentum shifts. As the trend is your friend, this tool aligns traders with market flow.
Pivot-based trendlines remain fixed once confirmed, offering reliable support and resistance zones. Regression lines, adjusting to price changes, highlight short-term trend paths. Both are vital for traders across asset classes.
🔵 How to Use
There are four line types that are seen in the image below; Precise uptrend (green) and downtrend (red) lines connect exact price extremes, while Pivot-based uptrend and downtrend lines use significant swing points, both remaining static once formed.
🟣 Precise Trendlines
Trendlines only form after pivot points are confirmed, ensuring reliability. This reduces false signals in choppy markets. Regression lines complement with real-time updates.
The indicator always draws two precise trendlines on confirmed pivot points, one ascending and one descending. These are colored distinctly to mark bullish and bearish trends. They remain fixed, serving as structural anchors.
🟣 Dynamic Regression Lines
Regression lines, adjusting dynamically with price, reflect the latest trend slope for real-time analysis. Use these to identify trend direction and potential reversals.
Regression lines, updated dynamically, reflect real-time price trends and extend in steps. Ascending lines are green, descending ones orange, with shades differing from trendlines. This aids visual distinction.
🟣 Bearish Chart
A Bullish State emerges when uptrend lines outweigh or match downtrend lines, with recent upward momentum signaling a potential rise. Check the trend count in the state table to confirm, using it to plan long positions.
🟣 Bullish Chart
A Bearish State is indicated when downtrend lines dominate or equal uptrend lines, with recent downward moves suggesting a potential drop. Review the state table’s trend count to verify, guiding short position entries. The indicator reflects this shift for strategic planning.
🟣 Alarm
Set alerts for state changes to stay informed of Bullish or Bearish shifts without constant monitoring. For example, a transition to Bullish State may signal a buying opportunity. Toggle alerts On or Off in the settings.
🟣 Market Status
A table summarizes the chart’s status, showing counts of ascending and descending lines. This real-time overview simplifies trend monitoring. Check it to assess market bias instantly.
Monitor the table to track line counts and trend dominance.
A higher count of ascending lines suggests bullish bias. This helps traders align with the prevailing trend.
🔵 Settings
Number of Trendlines : Sets total lines (max 10, min 3), balancing chart clarity and trend coverage.
Max Look Back : Defines historical bars (min 50) for pivot detection, ensuring robust trendlines.
Pivot Range : Sets pivot sensitivity (min 2), adjusting trendline precision to market volatility.
Show Table Checkbox : Toggles display of a table showing ascending/descending line counts.
Alarm : Enable or Disable the alert.
🔵 Conclusion
The multi slopes indicator, blending pivot-based trendlines and dynamic regression lines, maps market trends with precision. Its dual approach captures both structural and short-term momentum.
Customizable settings, like trendline count and pivot range, adapt to diverse trading styles. The real-time table simplifies trend monitoring, enhancing efficiency. It suits forex, stocks, and crypto markets.
While trendlines anchor long-term trends, regression lines track intraday shifts, offering versatility. Contextual analysis, like price action, boosts signal reliability. This indicator empowers data-driven trading decisions.

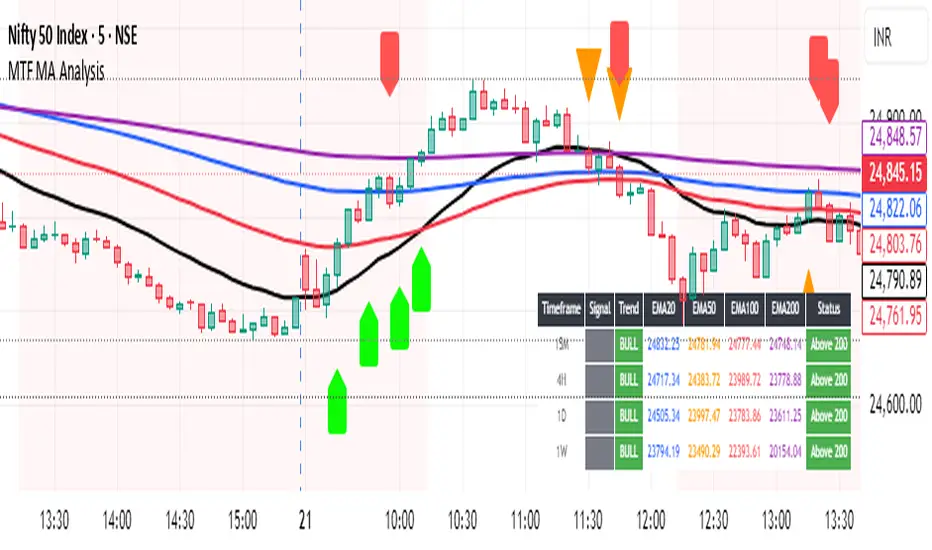
Multi-Timeframe MA Breakout/Breakdown Analysis📊 Overview
This sophisticated Pine Script indicator revolutionizes breakout/breakdown analysis by distinguishing between fake and genuine signals using a unique swing-level validation methodology. Unlike traditional moving average crossovers, this system validates price movements against historical swing points, providing traders with high-probability entry and exit signals across multiple timeframes.
🎯 Core Trading Methodology
The Swing Validation Concept:
Traditional MA breakouts often fail because they don't consider the context of previous price action. This indicator solves this by:
Recording swing levels when each MA is initially crossed
Validating subsequent crosses against these historical swing points
Classifying signals as fake or genuine based on this validation
Tracking signal evolution as price action develops
Signal Classification System:
🔻 Breakdown Analysis:
Fake Breakdown: Price cuts below MA but stays above the swing low from previous MA cut
Genuine Breakdown: Price cuts below MA and falls below the swing low from previous MA cut
Validation Chain: EMA 50 validates against EMA 20 swing low, EMA 100 against EMA 50 swing low, EMA 200 against EMA 100 swing low
🔺 Breakout Analysis:
Fake Breakout: Price crosses above MA but stays below the swing high from previous MA cross
Genuine Breakout: Price crosses above MA and exceeds the swing high from previous MA cross
Validation Chain: EMA 50 validates against EMA 20 swing high, EMA 100 against EMA 50 swing high, EMA 200 against EMA 100 swing high
📈 Signal Interpretation Guide
Visual Chart Signals:
Breakdown Signals:
🔻 Orange Triangle Down + "FAKE BREAKDOWN": Potential reversal opportunity - price likely to bounce
🔻 Red Triangle Down + "GENUINE BREAKDOWN": Trend continuation - expect further downside
🔺 Lime Triangle Up + "BULLISH REVERSAL": Strong buy signal after fake breakdown validation
Breakout Signals:
🔺 Orange Triangle Up + "FAKE BREAKOUT": Potential reversal opportunity - price likely to decline
🔺 Dark Red Triangle Up + "GENUINE BREAKOUT": Trend continuation - expect further upside
🔻 Fuchsia Triangle Down + "BEARISH REVERSAL": Strong sell signal after fake breakout validation
Multi-Timeframe Analysis Table:
Signal Column Interpretation:
"FAKE BD" (Orange): Fake breakdown detected - watch for bullish reversal
"GENUINE BD" (Red): Genuine breakdown - bearish continuation likely
"FAKE BO" (Orange): Fake breakout detected - watch for bearish reversal
"GENUINE BO" (Dark Red): Genuine breakout - bullish continuation likely
"BULLISH" (Lime): Bullish reversal confirmed - strong buy signal
"BEARISH" (Fuchsia): Bearish reversal confirmed - strong sell signal
Trend Column:
"BULL" (Green): EMAs in bullish sequence (20>50>100>200)
"BEAR" (Red): EMAs in bearish sequence (20<50<100<200)
"SIDE" (Gray): Sideways/mixed EMA alignment
Status Column:
"Above 200" (Green): Price above 200 EMA - bullish bias
"Below 200" (Red): Price below 200 EMA - bearish bias
"At 200" (Gray): Price at 200 EMA - neutral
💡 Trading Strategies
Strategy 1: Fake Signal Reversal Trading
For Long Entries (Fake Breakdown Reversal):
Wait for fake breakdown signal (orange triangle down)
Confirm bullish reversal (lime triangle up) when price reclaims EMAs
Enter long on bullish reversal confirmation
Stop loss below the swing low that validated the fake breakdown
Target next resistance level or previous swing high
For Short Entries (Fake Breakout Reversal):
Wait for fake breakout signal (orange triangle up)
Confirm bearish reversal (fuchsia triangle down) when price falls below EMAs
Enter short on bearish reversal confirmation
Stop loss above the swing high that validated the fake breakout
Target next support level or previous swing low
Strategy 2: Genuine Signal Trend Following
For Trend Continuation Longs:
Identify genuine breakout (dark red triangle up)
Confirm higher timeframe alignment (4H/1D showing bullish trend)
Enter on pullback to broken resistance (now support)
Stop loss below the validation swing high
Target measured move or next major resistance
For Trend Continuation Shorts:
Identify genuine breakdown (red triangle down)
Confirm higher timeframe alignment (4H/1D showing bearish trend)
Enter on pullback to broken support (now resistance)
Stop loss above the validation swing low
Target measured move or next major support
Strategy 3: Multi-Timeframe Confluence
High-Probability Setups:
Align signals across timeframes (15M signal + 4H trend confirmation)
Look for confluence (multiple timeframes showing same signal type)
Prioritize higher timeframe signals for swing/position trades
Use lower timeframes for precise entry timing
⚠️ Risk Management Rules
Position Sizing:
Fake signal trades: Reduce position size (higher risk, higher reward)
Genuine signal trades: Standard position size (trend following)
Multi-timeframe confluence: Increase position size (higher probability)
Stop Loss Guidelines:
Fake breakdown longs: Stop below validation swing low
Fake breakout shorts: Stop above validation swing high
Genuine signals: Stop beyond the MA that was broken
Reversals: Stop beyond the reversal invalidation level
Take Profit Strategies:
Scale out at key resistance/support levels
Trail stops using the 20 EMA for trend following
Take partial profits at 1:2 risk/reward ratio
Let winners run on strong trend continuation signals
🔧 Best Practices
Signal Validation:
Wait for candle close before acting on signals
Check volume confirmation on breakouts/breakdowns
Consider market context (news, earnings, etc.)
Avoid trading during low liquidity periods
Timeframe Selection:
Scalping: 15M signals with 4H trend filter
Day Trading: 4H signals with 1D trend filter
Swing Trading: 1D signals with 1W trend filter
Position Trading: 1W signals for major moves
Market Conditions:
Trending Markets: Focus on genuine signals for continuation
Range-Bound Markets: Focus on fake signals for reversals
High Volatility: Reduce position sizes and widen stops
Low Volatility: Look for breakout setups with volume
📋 Advanced Tips
Signal Evolution Monitoring:
Watch for signal transitions (fake becoming genuine or vice versa)
Adjust positions when signal classification changes
Use alerts to stay informed of signal updates
Monitor multiple timeframes for comprehensive analysis
Confluence Factors:
Support/Resistance levels at signal points
Volume spikes on genuine signals
RSI divergences with fake signals
Fibonacci retracements at reversal points
Common Pitfalls to Avoid:
Don't chase signals after significant moves
Don't ignore higher timeframe trends
Don't overtrade on every signal
Don't neglect risk management rules
🎯 Quick Reference
Bullish Signals Priority:
Bullish Reversal (Lime) - Highest priority
Fake Breakdown (Orange) - High probability reversal
Genuine Breakout (Dark Red) - Trend continuation
Bearish Signals Priority:
Bearish Reversal (Fuchsia) - Highest priority
Fake Breakout (Orange) - High probability reversal
Genuine Breakdown (Red) - Trend continuation
Multi-Timeframe Hierarchy:
1W: Major trend direction
1D: Intermediate trend and swing levels
4H: Short-term trend and entry timing
15M: Precise entry and exit points
⚡ Pro Tip: The most powerful signals occur when fake signals reverse into genuine signals in the opposite direction, creating high-momentum moves with excellent risk/reward ratios.
Disclaimer: This indicator is for educational purposes. Always combine with proper risk management, additional technical analysis, and fundamental research before making trading decisions. Past performance does not guarantee future results.
Tight Range Display with Background🌟 Tight Range Transparency Display with Background
What Is This Indicator?
Hey traders! Ever wanted a simple way to spot those quiet, low-volatility moments in the market that often signal a big move is coming? The Tight Range Transparency Display with Background does exactly that! This indicator highlights periods where the price is moving in a tight range—think of it as the calm before the storm. It paints the chart background blue to show these zones, with the shade getting darker the tighter the range becomes. It’s like having a visual cue to say, “Hey, something might be brewing here!”
Why You’ll Love It
Spot Key Moments Easily: The blue background makes it super easy to see when the market is in a tight range, which often happens before breakouts or big trends.
Customizable Settings: You can tweak the range thresholds to match your trading style—whether you’re looking for super tight zones or slightly broader ones.
Visual Clarity: The background gets darker when the range is tighter, giving you a quick sense of how compressed the price action is.
Perfect for Any Market: Works on stocks, forex, crypto, or any chart you trade, across any timeframe.
How to Use It
Add It to Your Chart:
Just copy this script into TradingView’s Pine Editor and hit "Add to Chart." It’ll overlay right on your price chart.
Tweak the Settings:
Open the indicator settings and use the dropdown menus to pick your preferred "Tight Range %" and "Wide Range %." For example, set a Tight Range % of 2.0% to catch smaller ranges, or go higher like 10.0% for broader ones.
You can also adjust the ATR Period (default is 5) to make the indicator more or less sensitive to recent price swings.
Watch for the Blue Background:
When the price enters a tight range, the chart background turns blue. The darker the blue, the tighter the range—meaning a potential breakout could be closer!
Trade Smarter:
Use these tight range zones to prepare for potential breakouts. For example, if you see a dark blue background, it might be a good time to watch for a big price move.
Pair this with other tools like support/resistance levels or volume spikes to confirm your trades.
Who Is This For?
Swing Traders: Perfect for spotting consolidation zones before a big swing.
Breakout Traders: Tight ranges often lead to breakouts—use this to time your entries.
Smart Money Followers: If you’re into smart money concepts, tight ranges can signal accumulation or distribution phases.
Beginners & Pros Alike: It’s easy to use for new traders but powerful enough for seasoned pros.
Real-World Example
Imagine you’re trading a stock on a 1-hour chart. You notice the background turns blue, and it’s getting darker over a few bars. This tells you the price range is tightening—maybe the stock is consolidating after a big move. You check your other indicators, see a volume spike, and spot a breakout above resistance. Boom! You catch the next big trend, all because this indicator helped you focus on the right moment.
Tips for Best Results
Try Different Timeframes: Tight ranges on a 15-minute chart might signal short-term moves, while a daily chart could highlight bigger trends.
Adjust for Your Market: For volatile markets like crypto, you might want a higher Tight Range % (e.g., 10.0%). For calmer markets like forex, try a lower setting (e.g., 2.0%).
Combine with Other Tools: Use this alongside trendlines, moving averages, or volume indicators to confirm your setups.
Why I Made This
I created this indicator because I wanted a simple, visual way to spot those critical low-volatility zones without cluttering my chart. The dynamic background color makes it intuitive to see when the market is “coiling up” for a potential move. I hope it helps you find better trading opportunities just like it does for me!
Let’s Connect
If you find this indicator helpful, I’d love to hear about it! Drop a comment or a rating to let me know how it’s working for you. Got ideas to make it even better? Feel free to message me on TradingView—I’m always open to suggestions.
Published On
Date: May 22, 2025
Happy trading, and may your charts always be in your favor! 🚀
How to Publish on TradingView
Open Pine Editor:
On TradingView, open a chart and go to the Pine Editor tab at the bottom.
Paste the Code:
Copy the script you provided and paste it into the Pine Editor.
Compile:
Click "Add to Chart" to ensure it compiles without errors.
Publish:
Click the "Publish Script" button (paper plane icon) in the Pine Editor.
Select "Publish New Script."
Add the Description:
Title: "Tight Range Transparency Display with Background"
Description: Copy the content above into the description field.
Visibility: Choose "Public" to share with everyone (or "Invite-Only" for restricted access).
Tags: Add tags like "tight range", "breakout", "smart money", "volatility", "swing trading".
Screenshot: Add a screenshot of the indicator on a chart, showing the blue background during a tight range.
Submit:
Click "Publish" to submit. TradingView will review it and make it live if it meets their guidelines.
Additional Notes
Screenshot Tip: Use a chart where the blue background is clearly visible (e.g., during a consolidation period) to make the indicator’s effect stand out.
Engage with Users: After publishing, respond to comments and feedback to build a positive reputation on TradingView.
This content is designed to be approachable and engaging, helping traders understand the value of your indicator and encouraging them to try it out.

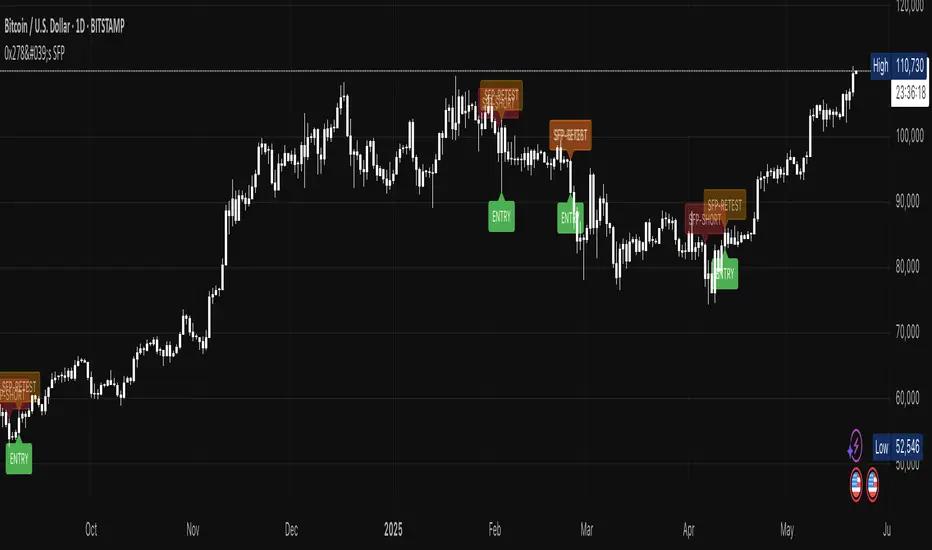
0x278's Swing-Failure-Pattern (SFP)0x278's Swing-Failure-Pattern (SFP) ‑ Confirmed Short
Table of Contents
Introduction
Core Concept – What Is an SFP?
How the Indicator Works
Visual Elements & Their Meaning
Input Parameters Explained
Step-by-Step Trading Playbook
Example Workflow (Daily BTC-USDT)
Alerts & Automation
Tips, Tricks & Best Practices
FAQ
Advanced Configuration & Asset-Class Playbook
1. Introduction
The Swing-Failure-Pattern (SFP) – Confirmed Short indicator spots and tracks bearish SFPs on any market and timeframe, with defaults tuned for Daily charts.
A bearish SFP occurs when price sweeps a prior swing high (liquidity grab) and then decisively rejects lower , signalling a possible trend reversal or sharp pullback.
This script automatically:
Identifies the liquidity sweep & rejection (‐"SFP-SHORT" label)
Confirms directional intent via a structure-breaking close below the setup low
Paints a preferred sell-on-retest zone and tracks its validity
Identifies optimal entry opportunities when price retests the zone
Generates optional retest and entry alerts when trading conditions appear
Self-cleans after a configurable number of bars – keeping your chart tidy
Default Timeframe : Daily
Default Market : Crypto / FX majors
Works On : All symbols + timeframes – simply adjust parameters.
2. Core Concept – What Is an SFP?
Sweep (Liquidity Grab) – Price trades above a meaningful swing high, triggering stops & inducing breakout buyers.
Rejection – The same bar (or the next) closes back below the swept high, invalidating the breakout.
Structure Break – Bears confirm intent by closing below the "setup low" (the most recent pivot low before the sweep).
Retest – Price retraces to the sweep zone. Traders seek entries inside the upper half of that zone with invalidation just above the swing high.
The indicator encodes these four steps so you can spot high-quality bearish reversals without manual bar-by-bar analysis.
3. How the Indicator Works
Phase: Sweep & Rejection
Script Logic: high > lastSwingHigh and close < lastSwingHigh
Visual Cue: Red SFP-SHORT label above candle
Phase: Structure Break
Script Logic: Close < setupLow while pattern locked
Visual Cue: Zone (red line-box) plotted; SFP-SHORT label stays
Phase: Retest Tracking
Script Logic: Zone stays active for retestExpiry bars or until tapped
Visual Cue: Orange SFP-RETEST label when hit
Phase: Entry Signal
Script Logic: Price rejection within retest zone
Visual Cue: Green ENTRY label at optimal entry point
Phase: Expiry / Cleanup
Script Logic: Zone deleted after expiry
Visual Cue: Labels fade but remain visible for reference
All calculations reset after each completed/expired pattern ensuring fresh, uncluttered signals.
4. Visual Elements & Their Meaning
SFP-SHORT (red) – Bar that swept a prior high and closed below it.
Red Box / Line – Preferred sell zone between the swing high (upper bound) and dynamic lower bound (see sizing methods). Extends right until filled/expired.
SFP-RETEST (orange) – Bar that first tags the zone after confirmation.
ENTRY (green) – Appears when a high-probability entry signal occurs within the retest zone.
EXPIRED (gray) – Appears when the retest zone expires without being hit.
Visual Persistence – Labels fade but remain visible after expiry for reference and historical analysis.
5. Input Parameters Explained
Pivot Detection
Pivot left / right : Bars left/right of the pivot that must stay below/above it. Tip : Symmetrical values (3/3) work best for clean structure.
Retest Management
Retest expiry (bars) : Lifespan of a retest zone before it is considered stale. Default: 14 bars on Daily . Tip : Shorten for intraday, lengthen for swing trading.
Retest Zone Sizing
Sizing method : Select Static %, ATR-based or Hybrid logic for the lower boundary. Tip : Hybrid balances tight stops with realistic fills.
Static % : Fixed fraction of sweep range when Static/Hybrid is selected. Tip : Higher % deepens zone & widens stop.
ATR period : Look-back length for ATR when volatility sizing is used. Tip : Increase to smooth choppy markets.
ATR multiplier : Multiplier applied to ATR in ATR-based/Hybrid mode. Tip : Higher value widens zone during volatility.
Visual – Retest Zone
Show retest zone box : Toggles drawing of the semi-transparent sell zone box. Tip : Disable for ultra-clean look.
Retest box color : Fill colour of the box (alpha = transparency). Tip : Match your chart theme.
Max retest boxes : How many historical boxes remain visible (0 = unlimited). Tip : Lower to boost performance.
Only show active boxes : Automatically deletes a box once it's hit. Tip : Reduces clutter during back-testing.
Visual – General
Minimal mode : Hides most visuals apart from critical labels. Tip : Ideal for screenshots.
Show retest zone line : Draws a vertical line linking upper/lower boundaries. Tip : Acts as a quick depth guide.
Show ENTRY labels : Plots 'ENTRY' on optimal candles. Tip : Turn off for manual confirmation.
Labels
Label size : Overall size of all labels. Tip : tiny / small / normal.
Use simple label style : Switches to pixel text style for labels. Tip : Faster rendering on low-spec machines.
Advanced
minPct / maxPct (hard-coded) : Internal floor/cap for Hybrid logic. Tip : Exposed in code for power-users only.
Zone-Sizing Methods
Static – Lower bound = sweepRange × staticPct.
ATR-based – Lower bound = ATR × multiplier, normalised to the sweepRange.
Hybrid – Uses the greater of Static and ATR-based (capped by an internal safety ceiling).
6. Step-by-Step Trading Playbook
Identify Context – Prefer setups against extended moves into obvious highs (e.g., daily swing highs, prior week high, round numbers).
Wait for SFP Confirmation – The indicator will label an SFP-SHORT only after the candle closes. Do not front-run.
Structure-Break Close – A close below setupLow turns the zone live. This is your go signal – prepare sell orders.
Place Orders in the Zone
Entry : Limit order anywhere between retestLower and the swing high.
Stop : 1-2 ticks/pips above the swing high.
Risk Management
Size position so risk per trade ≤ account risk % (common: 0.5-1%).
If no retest before retestExpiry bars → cancel order .
Targets
Conservative: First liquidity pocket / FVG below.
Aggressive: 2-3× risk or next HTF support.
Trail or Partial – Consider trailing stop once 1R is achieved or partial profit at 1R.
7. Example Workflow (Daily BTC-USDT)
BTC trades to a fresh one-month high at $31 050 sweeping prior highs.
Candle closes at $30 420 – below the swept high – SFP-SHORT label appears.
Two days later, candle closes below setupLow at $29 880 – confirmation & zone plotted (upper = $31 050, lower ≈ $30 550).
Five days later price retests the zone hitting $30 750 – SFP-RETEST alert fires, trade filled.
Stop placed @ $31 120 (70$ risk). 1R target = $29 680 reached four days later.
8. Alerts & Automation
SFP Short confirmed
Fires When: Structure-break close below setupLow.
Suggested Action: Prepare/submit sell-limit order in the zone.
SFP Short retest
Fires When: Price enters the retest zone.
Suggested Action: Monitor for entry signals or prepare for manual entry.
SFP Short Entry Signal
Fires When: Optimal entry conditions detected within retest zone.
Suggested Action: Execute short trade with defined risk parameters.
Use TradingView's Webhook URL to forward alerts to a trade-execution bot (e.g., PineConnector) for automated order placement.
9. Tips, Tricks & Best Practices
Combine with HTF Bias – Only take bearish SFPs in bearish weekly trend.
Watch Volume – High volume on the sweep bar adds conviction.
Time Window – SFPs during NY session FX / US session crypto tend to be stronger.
Cluster Zones – Multiple overlapping SFP zones increase probability; treat the cluster as one larger supply.
Avoid News – Skip SFPs forming minutes before high-impact macro news.
10. FAQ
Q: Can I use this on lower timeframes?
A: Yes – reduce retestExpiry (e.g., 15 bars on 15-minute) and test ATR-based sizing.
Q: Does it work for longs?
A: This script focuses on bearish SFPs. Clone & invert conditions for longs.
Q: Why did a zone disappear?
A: Either it expired (retestExpiry) without a retest or the cleanup routine removed old visuals to stay within Pine limits (500 objects per type).
Q: What's the difference between the "SFP-RETEST" and "ENTRY" signals?
A: "SFP-RETEST" indicates price has entered the zone, while "ENTRY" signals an optimal entry opportunity based on price rejection within the zone.
Q: How do I customize the label appearance?
A: Use the "Label size" and "Use simple label style" settings to adjust all labels to your preferred visual style.
Happy trading & trade safe!
11. Advanced Configuration & Asset-Class Playbook
Why does the retest box feel "too high" and how do I actually get filled? Use the quick tweaks below or the power-user code snippet to shape the zone to your personality and instrument.
11.1 Why the default box is shallow
The Static 25 % / ATR-Hybrid logic keeps stops small. Around 50 % of Daily BTC SFPs never look back – that's the cost of tight risk. If you need higher fill-rates, deepen the zone (11.2).
11.2 Three slider moves – no coding required
Retest zone sizing method – switch Static → Hybrid or ATR-based
Static % – raise from 0.25 → 0.45-0.60
ATR multiplier – raise from 1.0 → 1.5-2.0
Each turn pulls the lower edge of the box deeper while keeping the invalidation at the swing high.
11.3 One-liner for coders
To allow >60 % of the sweep range edit the source:
Old code:
minPct = 0.05
maxPct = 0.60
New code:
minPct = 0.05
maxPct = input.float(0.60, "Max retest % of sweep", step = 0.05, minval = 0.10, maxval = 0.95)
Then dial the cap up to ~0.80-0.90 from the settings panel.
11.4 If price never comes back…
No-retest partial – take 25-40 % size on the confirmation candle, stop above the high.
Lower-TF confirmation – drop to 4 h / 1 h and hunt an internal SFP or bearish FVG inside the sweep.
ATR trail – if price dumps immediately, trail the stop above each new lower-high.
11.5 Asset-Class Cheat-Sheet
Crypto – Daily : Static %: 0.20-0.35, ATR mult: 1.0, Retest Expiry: 12-20 . Notes : High volatility; sweeps expand fast.
FX Majors – 4 h/D : Static %: 0.25-0.40, ATR mult: 1.2, Retest Expiry: 15-25 . Notes : ATR handles session compression.
Index Futures – 1 h : Static %: 0.30-0.50, ATR mult: 1.5, Retest Expiry: 10-20 . Notes : Hybrid recommended; gaps tighten sweeps.
US Equities – 30 m : Static %: 0.35-0.55, ATR mult: 1.5-2.0, Retest Expiry: 10-14 . Notes : Consider no-retest entry on earnings spikes.
Always forward-test on your own symbol & timeframe ✔️
AxisAxis Indicator: Dynamic Trend Lines & Support/Resistance with Trading Mode Presets
Overview
The Axis indicator is a powerful, all-in-one tool for traders, designed to identify key trend lines and support/resistance (S&R) levels across various trading strategies. With 11 predefined trading modes—Scalping, Day Trading, Swing Trading, Long-Term, Position Trading, Breakout Trading, Mean Reversion, Trend Following, Range Trading, Volatility Trading, and Counter-Trend Trading—Axis adapts to your trading style by automatically adjusting parameters like volume Moving Average (MA) periods, fractal lookbacks, and alert proximity. Built-in timeframe validation ensures you’re using the optimal chart timeframe for your selected mode, with a warning label displayed if the timeframe is unsuitable. Whether you’re a scalper chasing quick moves or a position trader eyeing long-term trends, Axis provides precise, volume-filtered signals to enhance your trading decisions.
How It Works
Axis plots two sets of trend lines (A and B) and two sets of S&R levels (A and B) on your chart, each tailored to the selected trading mode:
Trend Lines (A & B): Identifies uptrend and downtrend lines using pivot highs/lows with mode-specific lookback periods. Lines are drawn only when volume exceeds the mode’s volume MA, ensuring high-probability signals.
Support/Resistance (A & B): Plots horizontal S&R levels based on pivot highs/lows, filtered by volume to highlight significant price levels.
Volume MA: Uses a mode-specific MA type (SMA, EMA, WMA, HMA, or VWMA) to validate pivots. MA periods are scaled by timeframe (e.g., 1m, 1h, Daily) and capped at 5,000 candles to prevent errors.
Timeframe Validation: Checks if the chart’s timeframe matches the mode’s recommended range (e.g., 5m–1h for Volatility Trading). If not, a yellow warning label appears (e.g., “Timeframe may not suit Scalping”).
Alerts: Triggers alerts for new trend lines, S&R levels, and price crosses, allowing real-time trade monitoring.
Trading Modes & Recommended Timeframes
Each mode is preconfigured with optimized settings for specific strategies and timeframes:
Scalping (1m–15m): Fast signals with short lookbacks (1–3 bars) and tight alerts (0.2%) for intraday scalps.
Day Trading (15m–1h): Intraday focus with moderate lookbacks (2–4 bars) and 0.3% alert proximity.
Swing Trading (1h–4h): Multi-day/week trades with balanced settings (2–5 bars, 0.5% alerts).
Long-Term (Daily–Weekly): Major trends with longer lookbacks (3–7 bars, 1.0% alerts).
Position Trading (Weekly–Monthly): Long-term moves with robust settings (4–20 bars, 1.5% alerts).
Breakout Trading (30m–4h): Detects breakouts with sensitive settings (1–4 bars, 0.25% alerts).
Mean Reversion (1h–Daily): Targets reversals with moderate settings (3–8 bars, 0.7% alerts).
Trend Following (4h–Weekly): Captures trends with longer lookbacks (4–18 bars, 1.2% alerts).
Range Trading (1h–4h): Optimized for consolidation with balanced settings (2–6 bars, 0.4% alerts).
Volatility Trading (5m–1h): High-volatility markets with ultra-sensitive settings (1–2 bars, 0.15% alerts).
Counter-Trend Trading (4h–Daily): Contrarian reversals with robust settings (3–9 bars, 0.9% alerts).
Key Features
11 Trading Modes: Preconfigured settings for diverse strategies, eliminating manual tuning.
Dynamic Volume MA: Supports SMA, EMA, WMA, HMA, and VWMA, scaled by timeframe for accuracy.
Timeframe Validation: Warns if the chart timeframe doesn’t suit the mode, preventing suboptimal setups.
Customizable Visuals: Adjust line widths and colors for trend lines and S&R levels.
Comprehensive Alerts: Alerts for new trend lines, S&R levels, and price crosses, integrable with TradingView’s alert system.
Performance Optimized: MA periods capped at 5,000 candles to avoid errors and ensure smooth operation.
How to Use
Add to Chart: Apply the Axis indicator to your TradingView chart.
Select Trading Mode: Choose a mode from the “Trading Mode” dropdown in the indicator settings (e.g., Volatility Trading for crypto on 5m).
Check Timeframe: Ensure your chart’s timeframe matches the mode’s recommended range (e.g., 5m–1h for Volatility Trading). A yellow warning label appears if the timeframe is unsuitable.
Customize Visuals: Adjust line widths and colors for trend lines (A & B) and S&R (A & B) in the settings.
Set Alerts: Create alerts for new trend lines, S&R levels, or price crosses via TradingView’s alert menu.
Trade Signals:
Trend Lines: Use uptrend/downtrend lines for trend confirmation or breakout setups.
S&R Levels: Trade bounces or breaks at support/resistance, confirmed by volume.
Alerts: Act on price cross alerts for entries/exits based on your strategy.
Tips for Best Results
Match Timeframe to Mode: Stick to recommended timeframes (e.g., 1h–4h for Swing Trading) to maximize signal accuracy. Heed warning labels for timeframe mismatches.
Test Across Assets: Volatility Trading shines in crypto during news events, while Range Trading suits forex/stocks in consolidation.
Backtest Strategies: Convert Axis to a strategy (e.g., enter on S&R cross, exit after X bars) to validate performance.
Optimize for Performance: If lag occurs on low timeframes, reduce the MA cap to 2,500 (edit math.min(..., 2500) in the code).
Combine with Other Tools: Pair Axis with indicators like RSI or MACD for confluence.
Why Choose Axis?
Axis simplifies technical analysis by offering a single indicator that adapts to your trading style. Its mode-based presets, volume-filtered signals, and timeframe validation make it ideal for traders of all levels, from scalpers to long-term investors. Whether you’re trading crypto, forex, or stocks, Axis delivers actionable insights with minimal setup.
Feedback & Support
If you have questions, suggestions, or need help customizing Axis, feel free to comment or contact me via TradingView. Your feedback helps improve the indicator for the community!

Value Scanner | QuantEdgeB📡 Value Scanner | QuantEdgeB
🔍 What is the Value Scanner?
The Value Scanner by QuantEdgeB is a volatility-adaptive valuation framework that dynamically evaluates where price sits relative to a custom “Fair Value” zone. It combines your choice of moving average engine (SMA, WMA, VIDYA, etc.) with multi-layered standard deviation or ATR-based bands to highlight extreme conditions, reversal zones, and statistical overextensions in real time.
💡 Think of Value Scanner as a radar grid, continuously scanning market terrain and painting a full spectrum from balance to extreme disequilibrium.
⚙️ Core Components
✅ Customizable Moving Average Core
At the heart of the scanner lies a flexible moving average engine:
• Choose from 12+ advanced types: 𝓦𝓜𝓐, 𝓥𝓦𝓜𝓐, 𝓥𝓘𝓓𝓨𝓐, 𝓢𝓜𝓜𝓐, 𝓐𝓛𝓜𝓐, 𝓛𝓢𝓜𝓐, and more.
• Fair Value is derived from this base and acts as the center of the statistical zones.
✅ Volatility-Driven Band Construction
Two volatility methods power the adaptive zones:
• Average True Range (ATR): Ideal for reactive, price-based spreads.
• Standard Deviation (SD): Better for modeling reversion and deviation symmetry.
The scanner builds up to ±5σ zones, dynamically updating in real time.
🎯 Signal and Zone Identification
🧭 Deviation Labels
The system assigns a statistical label at every candle:
• From +0.5σ to +5σ for increasing levels of overextension upward.
• From -0.5σ to -5σ for oversold and undervalued conditions.
🌐 Market Stage Detection
Each deviation zone is translated into an intuitive market phrase such as:
• “𝓔𝔁𝓽𝓻𝓮𝓶𝓮𝓵𝔂 𝓞𝓿𝓮𝓻𝓫𝓸𝓾𝓰𝓱𝓽”
• “𝓜𝓲𝓭 𝓥𝓪𝓵𝓾𝓮 / 𝓑𝓪𝓵𝓪𝓷𝓬𝓮𝓭”
• “𝓜𝓪𝔁𝓲𝓶𝓾𝓶 𝓔𝔁𝓽𝓮𝓷𝓼𝓲𝓸𝓷 𝓓𝓸𝔀𝓷”
These phrases help you intuitively gauge risk, reward, and imbalance without needing to study a chart for long.
🔺 Signal Mechanics
📌 Reversal Signals (Optional)
• Automatic buy signals when price crosses above key lower deviation levels.
• Sell signals when price crosses below upper deviation bands.
• Ideal for mean-reversion setups or high-probability reversal plays.
🖼️ Visual Overlay Engine
• Beautifully shaded volatility bands with decreasing opacity as they move away from fair value.
• Background coloring highlights extreme price zones for fast visual alerts.
• Built-in "table display" summarizing the current base, volatility method, direction, fair value, and deviation stage.
📊 Table Overlay Features
The live diagnostic table (position adjustable) displays:
• 📈 Current Base MA Type
• 🌡️ Volatility Method in use (ATR or SD)
• 🧭 Trend direction (rising/falling/neutral)
• 🧮 Current Deviation Label (+2σ, -3σ, etc.)
• 🚦 Interpretive Stage Phrase ("Strongly Overbought", etc.)
• 📍 Real-Time Fair Value
• 🚨 Upper & Lower Extremes
🧠 Why Use the Value Scanner?
This tool is designed for traders who want to:
• Identify price extremes relative to statistical norms.
• Time entries and exits based on price's relationship to value zones.
• Visualize volatility structure without clutter.
• Combine trend-following or mean-reversion logic with elegant overlays and table analytics.
💼 Ideal Use Cases
• Swing trading: Spot overextensions or returns to mean.
• Options traders: Gauge volatility compression or expansion.
• Reversion systems: Generate contrarian signals at edge zones.
• Trend continuation: Use +1σ or -1σ as breakout validation levels.
🧬 Default Settings
• Base Type: 𝓦𝓜𝓐
• Length: 21
• Volatility Type: 𝓐𝓿𝓰. 𝓣𝓻𝓾𝓮 𝓡𝓪𝓷𝓰𝓮
•. Volatility Lengths: ATR 14 / Stdev 30
🧬 In Summary
Value Scanner | QuantEdgeB is not just a volatility band indicator — it’s a contextual market scanner that combines price equilibrium theory with precision deviation mapping. It adds statistical insight, color-coded extremes, and narrative stage identification — all in real time.
Whether you’re trend-following or fading extremes, this system helps you locate value, measure dislocation, and trade with mathematical confidence.
📌 Trade with Statistical Precision | Powered by QuantEdgeB
🔹 Disclaimer: Past performance is not indicative of future results.
🔹 Strategic Advice: Always backtest, optimize, and align parameters with your trading objectives and risk tolerance before live trading.

Enhanced Volume Trend Indicator with BB SqueezeEnhanced Volume Trend Indicator with BB Squeeze: Comprehensive Explanation
The visualization system allows traders to quickly scan multiple securities to identify high-probability setups without detailed analysis of each chart. The progression from squeeze to breakout, supported by volume trend confirmation, offers a systematic approach to identifying trading opportunities.
The script combines multiple technical analysis approaches into a comprehensive dashboard that helps traders make informed decisions by identifying high-probability setups while filtering out noise through its sophisticated confirmation requirements. It combines multiple technical analysis approaches into an integrated visual system that helps traders identify potential trading opportunities while filtering out false signals.
Core Features
1. Volume Analysis Dashboard
The indicator displays various volume-related metrics in customizable tables:
AVOL (After Hours + Pre-Market Volume): Shows extended hours volume as a percentage of the 21-day average volume with color coding for buying/selling pressure. Green indicates buying pressure and red indicates selling pressure.
Volume Metrics: Includes regular volume (VOL), dollar volume ($VOL), relative volume compared to 21-day average (RVOL), and relative volume compared to 90-day average (RVOL90D).
Pre-Market Data: Optional display of pre-market volume (PVOL), pre-market dollar volume (P$VOL), pre-market relative volume (PRVOL), and pre-market price change percentage (PCHG%).
2. Enhanced Volume Trend (VTR) Analysis
The Volume Trend indicator uses adaptive analysis to evaluate buying and selling pressure, combining multiple factors:
MACD (Moving Average Convergence Divergence) components
Volume-to-SMA (Simple Moving Average) ratio
Price direction and market conditions
Volume change rates and momentum
EMA (Exponential Moving Average) alignment and crossovers
Volatility filtering
VTR Visual Indicators
The VTR score ranges from 0-100, with values above 50 indicating bullish conditions and below 50 indicating bearish conditions. This is visually represented by colored circles:
"●" (Filled Circle):
Green: Strong bullish trend (VTR ≥ 80)
Red: Strong bearish trend (VTR ≤ 20)
"◯" (Hollow Circle):
Green: Moderate bullish trend (VTR 65-79)
Red: Moderate bearish trend (VTR 21-35)
"·" (Small Dot):
Green: Weak bullish trend (VTR 55-64)
Red: Weak bearish trend (VTR 36-45)
"○" (Medium Hollow Circle): Neutral conditions (VTR 46-54), shown in gray
In "Both" display mode, the VTR shows both the numerical score (0-100) alongside the appropriate circle symbol.
Enhanced VTR Settings
The Enhanced Volume Trend component offers several advanced customization options:
Adaptive Volume Analysis (volTrendAdaptive):
When enabled, dynamically adjusts volume thresholds based on recent market volatility
Higher volatility periods require proportionally higher volume to generate significant signals
Helps prevent false signals during highly volatile markets
Keep enabled for most trading conditions, especially in volatile markets
Speed of Change Weight (volTrendSpeedWeight, range 0-1):
Controls emphasis on volume acceleration/deceleration rather than absolute levels
Higher values (0.7-1.0): More responsive to new volume trends, better for momentum trading
Lower values (0.2-0.5): Less responsive, better for trend following
Helps identify early volume trends before they fully develop
Momentum Period (volTrendMomentumPeriod, range 2-10):
Defines lookback period for volume change rate calculations
Lower values (2-3): More responsive to recent changes, better for short timeframes
Higher values (7-10): Smoother, better for daily/weekly charts
Directly affects how quickly the indicator responds to new volume patterns
Volatility Filter (volTrendVolatilityFilter):
Adjusts significance of volume by factoring in current price volatility
High volume during high volatility receives less weight
High volume during low volatility receives more weight
Helps distinguish between genuine volume-driven moves and volatility-driven moves
EMA Alignment Weight (volTrendEmaWeight, range 0-1):
Controls importance of EMA alignments in final VTR calculation
Analyzes multiple EMA relationships (5, 10, 21 period)
Higher values (0.7-1.0): Greater emphasis on trend structure
Lower values (0.2-0.5): More focus on pure volume patterns
Display Mode (volTrendDisplayMode):
"Value": Shows only numerical score (0-100)
"Strength": Shows only symbolic representation
"Both": Shows numerical score and symbol together
3. Bollinger Band Squeeze Detection (SQZ)
The BB Squeeze indicator identifies periods of low volatility when Bollinger Bands contract inside Keltner Channels, often preceding significant price movements.
SQZ Visual Indicators
"●" (Filled Circle): Strong squeeze - high probability setup for an impending breakout
Green: Strong squeeze with bullish bias (likely upward breakout)
Red: Strong squeeze with bearish bias (likely downward breakout)
Orange: Strong squeeze with unclear direction
"◯" (Hollow Circle): Moderate squeeze - medium probability setup
Green: With bullish EMA alignment
Red: With bearish EMA alignment
Orange: Without clear directional bias
"-" (Dash): Gray dash indicates no squeeze condition (normal volatility)
The script identifies squeeze conditions through multiple methods:
Bollinger Bands contracting inside Keltner Channels
BB width falling to bottom 20% of recent range (BB width percentile)
Very narrow Keltner Channel (less than 5% of basis price)
Tracking squeeze duration in consecutive bars
Different squeeze strengths are detected:
Strong Squeeze: BB inside KC with tight BB width and narrow KC
Moderate Squeeze: BB inside KC with either tight BB width or narrow KC
No Squeeze: Normal market conditions
4. Breakout Detection System
The script includes two breakout indicators working in sequence:
4.1 Pre-Breakout (PBK) Indicator
Detects potential upcoming breakouts by analyzing multiple factors:
Squeeze conditions lasting 2-3 bars or more
Significant price ranges
Strong volume confirmation
EMA/MACD crossovers
Consistent price direction
PBK Visual Indicators
"●" (Filled Circle): Detected pre-breakout condition
Green: Likely upward breakout (bullish)
Red: Likely downward breakout (bearish)
Orange: Direction not yet clear, but breakout likely
"-" (Dash): Gray dash indicates no pre-breakout condition
The PBK uses sophisticated conditions to reduce false signals including minimum squeeze length, significant price movement, and technical confirmations.
4.2 Breakout (BK) Indicator
Confirms actual breakouts in progress by identifying:
End of squeeze or strong expansion of Bollinger Bands
Volume expansion
Price moving outside Bollinger Bands
EMA crossovers with volume confirmation
MACD crossovers with significant price range
BK Visual Indicators
"●" (Filled Circle): Confirmed breakout in progress
Green: Upward breakout (bullish)
Red: Downward breakout (bearish)
Orange: Unusual breakout pattern without clear direction
"◆" (Diamond): Special breakout conditions (meets some but not all criteria)
"-" (Dash): Gray dash indicates no breakout detected
The BK indicator uses advanced filters for confirmation:
Requires consecutive breakout signals to reduce false positives
Strong volume confirmation requirements (40% above average)
Significant price movement thresholds
Consistency checks between price action and indicators
5. Market Metrics and Analysis
Price Change Percentage (CHG%)
Displays the current percentage change relative to the previous day's close, color-coded green for positive changes and red for negative changes.
Average Daily Range (ADR%)
Calculates the average daily percentage range over a specified period (default 20 days), helping traders gauge volatility and set appropriate price targets.
Average True Range (ATR)
Shows the Average True Range value, a volatility indicator developed by J. Welles Wilder that measures market volatility by decomposing the entire range of an asset price for that period.
Relative Strength Index (RSI)
Displays the standard 14-period RSI, a momentum oscillator that measures the speed and change of price movements on a scale from 0 to 100.
6. External Market Indicators
QQQ Change
Shows the percentage change in the Invesco QQQ Trust (tracking the Nasdaq-100 Index), useful for understanding broader tech market trends.
UVIX Change
Displays the percentage change in UVIX, a volatility index, providing insight into market fear and potential hedging activity.
BTC-USD
Shows the current Bitcoin price from Coinbase, useful for traders monitoring crypto correlation with equities.
Market Breadth (BRD)
Calculates the percentage difference between ATHI.US and ATLO.US (high vs. low securities), indicating overall market direction and strength.
7. Session Analysis and Volume Direction
Session Detection
The script accurately identifies different market sessions:
Pre-market: 4:00 AM to 9:30 AM
Regular market: 9:30 AM to 4:00 PM
After-hours: 4:00 PM to 8:00 PM
Closed: Outside trading hours
This detection works on any timeframe through careful calculation of current time in seconds.
Buy/Sell Volume Direction
The script analyzes buying and selling pressure by:
Counting up volume when close > open
Counting down volume when close < open
Tracking accumulated volume within the day
Calculating intraday pressure (up volume minus down volume)
Enhanced AVOL Calculation
The improved AVOL calculation works in all timeframes by:
Estimating typical pre-market and after-hours volume percentages
Combining yesterday's after-hours with today's pre-market volume
Calculating this as a percentage of the 21-day average volume
Determining buying/selling pressure by analyzing after-hours and pre-market price changes
Color-coding results: green for buying pressure, red for selling pressure
This calculation is particularly valuable because it works consistently across any timeframe.
Customization Options
Display Settings
The dashboard has two customizable tables: Volume Table and Metrics Table, with positions selectable as bottom_left or bottom_right.
All metrics can be individually toggled on/off:
Pre-market data (PVOL, P$VOL, PRVOL, PCHG%)
Volume data (AVOL, RVOL Day, RVOL 90D, Volume, SEED_YASHALGO_NSE_BREADTH:VOLUME )
Price metrics (ADR%, ATR, RSI, Price Change%)
Market indicators (QQQ, UVIX, Breadth, BTC-USD)
Analysis indicators (Volume Trend, BB Squeeze, Pre-Breakout, Breakout)
These toggle options allow traders to customize the dashboard to show only the metrics they find most valuable for their trading style.
Table and Text Customization
The dashboard's appearance can be customized:
Table background color via tableBgColor
Text color (White or Black) via textColorOption
The indicator uses smart formatting for volume and price values, automatically adding appropriate suffixes (K, M, B) for readability.
MACD Configuration for VTR
The Volume Trend calculation incorporates MACD with customizable parameters:
Fast Length: Controls the period for the fast EMA (default 3)
Slow Length: Controls the period for the slow EMA (default 9)
Signal Length: Controls the period for the signal line EMA (default 5)
MACD Weight: Controls how much influence MACD has on the volume trend score (default 0.3)
These settings allow traders to fine-tune how momentum is factored into the volume trend analysis.
Bollinger Bands and Keltner Channel Settings
The Bollinger Bands and Keltner Channels used for squeeze detection have preset (hidden) parameters:
BB Length: 20 periods
BB Multiplier: 2.0 standard deviations
Keltner Length: 20 periods
Keltner Multiplier: 1.5 ATR
These settings follow standard practice for squeeze detection while maintaining simplicity in the user interface.
Practical Trading Applications
Complete Trading Strategies
1. Squeeze Breakout Strategy
This strategy combines multiple components of the indicator:
Wait for a strong squeeze (SQZ showing ●)
Look for pre-breakout confirmation (PBK showing ● in green or red)
Enter when breakout is confirmed (BK showing ● in same direction)
Use VTR to confirm volume supports the move (VTR ≥ 65 for bullish or ≤ 35 for bearish)
Set profit targets based on ADR (Average Daily Range)
Exit when VTR begins to weaken or changes direction
2. Volume Divergence Strategy
This strategy focuses on the volume trend relative to price:
Identify when price makes a new high but VTR fails to confirm (divergence)
Look for VTR to show weakening trend (● changing to ◯ or ·)
Prepare for potential reversal when SQZ begins to form
Enter counter-trend position when PBK confirms reversal direction
Use external indicators (QQQ, BTC, Breadth) to confirm broader market support
3. Pre-Market Edge Strategy
This strategy leverages pre-market data:
Monitor AVOL for unusual pre-market activity (significantly above 100%)
Check pre-market price change direction (PCHG%)
Enter position at market open if VTR confirms direction
Use SQZ to determine if volatility is likely to expand
Exit based on RVOL declining or price reaching +/- ADR for the day
Market Context Integration
The indicator provides valuable context for trading decisions:
QQQ change shows tech market direction
BTC price shows crypto market correlation
UVIX change indicates volatility expectations
Breadth measurement shows market internals
This context helps traders avoid fighting the broader market and align trades with overall market direction.
Timeframe Optimization
The indicator is designed to work across different timeframes:
For day trading: Focus on AVOL, VTR, PBK/BK, and use shorter momentum periods
For swing trading: Focus on SQZ duration, VTR strength, and broader market indicators
For position trading: Focus on larger VTR trends and use EMA alignment weight
Advanced Analytical Components
Enhanced Volume Trend Score Calculation
The VTR score calculation is sophisticated, with the base score starting at 50 and adjusting for:
Price direction (up/down)
Volume relative to average (high/normal/low)
Volume acceleration/deceleration
Market conditions (bull/bear)
Additional factors are then applied, including:
MACD influence weighted by strength and direction
Volume change rate influence (speed)
Price/volume divergence effects
EMA alignment scores
Volatility adjustments
Breakout strength factors
Price action confirmations
The final score is clamped between 0-100, with values above 50 indicating bullish conditions and below 50 indicating bearish conditions.
Anti-False Signal Filters
The indicator employs multiple techniques to reduce false signals:
Requiring significant price range (minimum percentage movement)
Demanding strong volume confirmation (significantly above average)
Checking for consistent direction across multiple indicators
Requiring prior bar consistency (consecutive bars moving in same direction)
Counting consecutive signals to filter out noise
These filters help eliminate noise and focus on high-probability setups.
MACD Enhancement and Integration
The indicator enhances standard MACD analysis:
Calculating MACD relative strength compared to recent history
Normalizing MACD slope relative to volatility
Detecting MACD acceleration for stronger signals
Integrating MACD crossovers with other confirmation factors
EMA Analysis System
The indicator uses a comprehensive EMA analysis system:
Calculating multiple EMAs (5, 10, 21 periods)
Detecting golden cross (10 EMA crosses above 21 EMA)
Detecting death cross (10 EMA crosses below 21 EMA)
Assessing price position relative to EMAs
Measuring EMA separation percentage
Recent Enhancements and Evolution
Version 5.2 includes several improvements:
Enhanced AVOL to show buying/selling direction through color coding
Improved VTR with adaptive analysis based on market conditions
AVOL display now works in all timeframes through sophisticated estimation
Removed animal symbols and streamlined code with bright colors for better visibility
Improved anti-false signal filters throughout the system
Optimizing Indicator Settings
For Different Market Types
Range-Bound Markets:
Lower EMA Alignment Weight (0.2-0.4)
Higher Speed of Change Weight (0.8-1.0)
Focus on SQZ and PBK signals for breakout potential
Trending Markets:
Higher EMA Alignment Weight (0.7-1.0)
Moderate Speed of Change Weight (0.4-0.6)
Focus on VTR strength and BK confirmations
Volatile Markets:
Enable Volatility Filter
Enable Adaptive Volume Analysis
Lower Momentum Period (2-3)
Focus on strong volume confirmation (VTR ≥ 80 or ≤ 20)
For Different Asset Classes
Equities:
Standard settings work well
Pay attention to AVOL for gap potential
Monitor QQQ correlation
Futures:
Consider higher Volume/RVOL weight
Reduce MACD weight slightly
Pay close attention to SQZ duration
Crypto:
Higher volatility thresholds may be needed
Monitor BTC price for correlation
Focus on stronger confirmation signals
Integrated Visual System for Trading Decisions
The colored circle indicators create an intuitive visual system for quick market assessment:
Progression Sequence: SQZ (Squeeze) → PBK (Pre-Breakout) → BK (Breakout)
This sequence often occurs in order, with the squeeze leading to pre-breakout conditions, followed by an actual breakout.
VTR (Volume Trend): Provides context about the volume supporting these movements.
Color Coding: Green for bullish conditions, red for bearish conditions, and orange/gray for neutral or undefined conditions.

Position Size Calculator (Fixed % or ATR-based Stop Support)Position Size Calculator (Fixed % or ATR-based Stop Support)
Purpose and Background
This indicator allows traders to calculate appropriate position sizes directly on the chart, based on a key rule:
“What percentage of your capital are you willing to risk per trade?”
While many traders focus on entries and indicators, position sizing and risk allocation are often overlooked.
This tool visualizes and simplifies the “1% risk rule” promoted by IBD (Investor’s Business Daily) and William J. O’Neil, helping both beginners and experienced traders maintain disciplined capital management.
Key Features
Automatically calculates and displays:
・ Position Size
The number of units (shares, contracts, coins) you can hold based on your stop-loss range and risk allowance.
・ Stop Price
The price level at which your stop-loss would be triggered.
・ Risk Amount
The maximum loss per trade based on your portfolio size and risk percentage.
Two stop-loss modes available:
・ Fixed % Mode
O’Neil suggests using up to 8% stop-loss in uptrends and keeping it tighter (around 4%) in corrections. This mode allows flexible manual settings.
・ ATR-Based Mode
Uses the asset’s average volatility to dynamically calculate stop-loss width using the Average True Range (ATR).
ATR Usage and Recommended Settings
ATR helps you avoid noise-based stop-outs and align your risk with market volatility.
There are two parameters you can adjust:
・ ATR Length
Defines how many bars are used to calculate the average range.
・Shorter values (5–10) respond faster for day trades
・Longer values (14–21) offer smoother ranges for swing/position trades(Default is 14)
・ATR Multiplier
Sets how wide the stop-loss is by multiplying the ATR value:
・Day trading: 1.0–1.5×
・Swing trading: 1.5–2.5×
・Position trading: 2.0–3.0×
Practical Examples: Risk % × Stop-Loss % → Max Positions
This tool helps estimate how many positions you can hold in a portfolio based on your risk per trade and stop width.
Examples:
・Risk 0.5%, Stop 8% → Max 16 positions
・Risk 0.5%, Stop 4% → Max 8 positions
・Risk 1.0%, Stop 8% → Max 8 positions
・Risk 1.0%, Stop 4% → Max 4 positions
・Risk 2.0%, Stop 8% → Max 4 positions
・Risk 2.0%, Stop 4% → Max 2 positions
These assume worst-case scenarios where all positions are stopped out simultaneously within your overall portfolio risk limit.
Display & Customization Options
・ Currency Display: USD or JPY
No currency conversion is applied. Select based on your trading region (e.g., USD for U.S. stocks, JPY for Japanese stocks).
Support for additional currencies can be added upon request.
・ Show/Hide Decimal Places
Toggle decimals for better visibility. Ideal for fractional assets like crypto and CFDs.
・ Position of Output
Choose from top-right, middle-right, or bottom-right on the chart.
・ Text Display Size: Large / Normal / Small
Choose the table size that best suits your viewing preferences.
・ Explanation of Displayed Labels
・ Position Size : Units to buy/sell based on risk
・ Stop Price : Price where stop-loss is triggered
・ Risk Amount : Max loss allowed for the trade
How to Use
1、Set your Portfolio Size
2、Choose your Currency (USD or JPY)
3、Input Risk per Trade (%) (e.g., 1%)
4、Select Stop Loss Method
・ Fixed % : Enter a manual stop-loss percent (e.g., 8%)
・ ATR : Then also enter:
・ ATR Length : Number of bars used to calculate ATR (e.g., 14)
・ ATR Multiplier : Factor applied to ATR to determine stop-loss (e.g., 2.0)
5、Adjust decimals, label position, or text size as needed
6、The result is displayed in a table directly on your chart
Notes
・ Uses the current close price (close) as the basis
Real-time bid/ask data isn't available in Pine Script, so the close price is used for consistent results.
・ No buy/sell signals are generated
This tool is for position sizing and risk calculation only, not trade entries.
Recommended For
・Traders who want precise, rule-based position sizing
・Users following IBD or O’Neil’s 1% risk principle
・Those incorporating ATR for stop-loss strategies
・Multi-asset traders (stocks, crypto, CFDs, etc.)
・ Anyone who wants to calculate position size and risk without using a calculator or external tool—fully inside TradingView
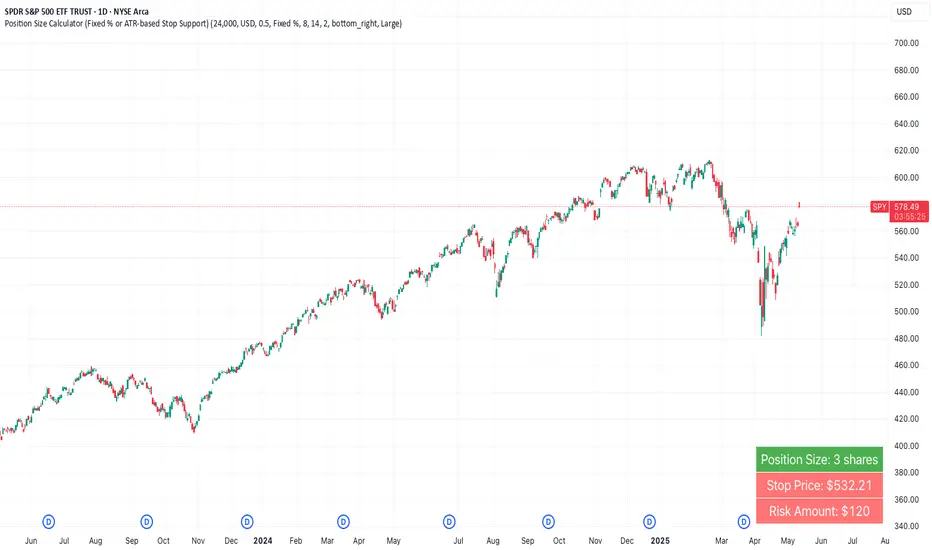
TCP | Money Management indicator | Crypto Version📌 TCP | Money Management Indicator | Crypto Version
A robust, multi-target risk and capital management indicator tailored for crypto traders. Whether you're trading spot, perpetual futures, or leverage tokens, this tool empowers you with precise control over risk, reward, and position sizing—directly on your chart. Eliminate guesswork and trade with confidence.
🔰 Introduction: Master Your Capital, Master Your Trades
Poor money management is the number one reason traders lose their accounts, even with solid strategies. The TCP Money Management Indicator, built by Trade City Pro (TCP), solves this problem by providing a structured, rule-based approach to capital allocation.
Want to dive deeper into the concept of money management? Check out our comprehensive tutorial on TradingView, " TradeCityPro Academy: Money Management ", to understand the principles that power this indicator and transform your trading mindset.
This indicator equips you to:
• Calculate optimal position sizes based on your capital, risk percentage, and leverage
• Set up to 5 customizable take-profit targets with partial close percentages
• Access real-time metrics like Risk-to-Reward (R/R), USD profit, and margin usage
• Trade with discipline, avoiding emotional or inconsistent decisions
💸 Money Management Formula
The indicator uses a professional capital allocation model:
Position Size = (Capital × Risk %) ÷ (Stop Loss % × Leverage)
From this, it calculates:
• Total risk amount in USD
• Optimal position size for your trade
• Margin required for each take-profit target
• Adjusted R/R for each target, accounting for partial position closures
🛠 How to Use
Enter Trade Parameters: Input your capital, risk %, leverage, entry price, and stop-loss price.
Set Take-Profit Targets: Enable 1 to 5 take-profit levels and specify the percentage of the position to close at each.
Real-Time Calculations: The indicator automatically computes:
• R/R ratio for each target
• Profit in USD for each partial close
• Margin used per target (in % and USD)
Visualize Your Trade:
• Price levels for entry, stop-loss, and take-profits are plotted on the chart.
• A dynamic info panel on the left side displays all key metrics.
🔄 Dynamic Adjustments: As each take-profit target is hit and a portion of the position is closed, the indicator recalculates the remaining position size, expected profit, R/R, and margin for subsequent targets. This ensures accuracy and reflects real-world trade behavior.
📊 Table Overview
The left-side panel provides a clear snapshot:
• Trade Setup: Capital, entry price, stop-loss, risk amount, and position size
• Per Target: Percentage closed, R/R, profit in USD, and margin used
• Summary: Total expected profit across all targets
⚙️ Settings Panel
• Total Capital ($): Your account size for the trade
• Risk per Trade (%): The percentage of capital you’re willing to risk
• Leverage: The leverage applied to the trade
• Entry/Stop-Loss Prices: Define your trade’s risk zone
• Take-Profit Targets (1–5): Set price levels and percentage to close at each
🔍 Use Case Example
Imagine you have $1,000 capital, risking 1%, using 10x leverage:
• Entry: $100 | Stop-Loss: $95
• TP1: $110 (close 50%) | TP2: $115 (close 50%)
The indicator calculates the exact position size, profit at each target, and margin allocation in real time, with all metrics displayed on the chart.
✅ Why Traders Love It
• Precision: No more manual calculations or guesswork
• Versatility: Works on all crypto pairs (BTC, ETH, altcoins, etc.)
• Flexibility: Perfect for scalping, swing trading, or futures strategies
• Universal: Compatible with all timeframes
• Transparency: Fully manual, with clear and reliable outputs
🧩 Built by Trade City Pro (TCP)
Developed by TCP, a trusted name in trading tools, used by over 150,000 traders worldwide. This indicator is coded in Pine Script v5, ensuring compatibility with TradingView’s platform.
🧾 Final Notes
• No Auto-Trading: This is a manual tool for disciplined traders
• No Repainting: All calculations are accurate and non-repainting
• Tested: Rigorously validated across major crypto pairs
• Publish-Ready: Built for seamless use on TradingView
🔗 Resources
• Money Management Tutorial: Learn the fundamentals of capital management with our detailed guide: TradeCityPro Academy: Money Management
• TradingView Profile: Explore more tools by TCP on TradingView

Hidden Gap`s VSA Volume Auto-TimeframeHidden Gap's VSA Volume with Auto-Timeframe Adaptation
Enhanced Version of Classic Volume Spread Analysis Indicator
Description:
This evolved version of the original "Hidden Gap's VSA Volume" indicator introduces intelligent timeframe adaptation while preserving its core Volume Spread Analysis (VSA) logic. The key enhancement automatically synchronizes volume calculations with your chart's current timeframe, eliminating manual resolution adjustments.
New Features:
✅ Auto-Timeframe Detection
Dynamically adjusts to any chart timeframe (1M/5M/1H/4H/D/W/M)
✅ Smart Resolution Switching
Seamlessly works across multiple timeframes without parameter changes
✅ Manual Override Option
Retains custom resolution input for multi-timeframe analysis (e.g., view weekly volume on daily charts)
✅ Modernized Engine
Upgraded to Pine Script v6 for optimal TradingView performance
Core Functionality Preserved:
• Multi-layer volume analysis using 40/20/2-period comparisons
• Color-coded histogram detecting:
Black: 40-period high volume
Gray: 20-period low volume
Purple: 2-period volume contraction
Blue/Red: Immediate volume changes
• Integrated 20-period SMA reference line
Usage Scenarios:
Intraday Trading: Auto-adjusts from 1-minute to 4-hour charts
Multi-Timeframe Analysis: Compare current volume against higher timeframe patterns
Swing Trading: Maintain consistent analysis across D/W/M timeframes
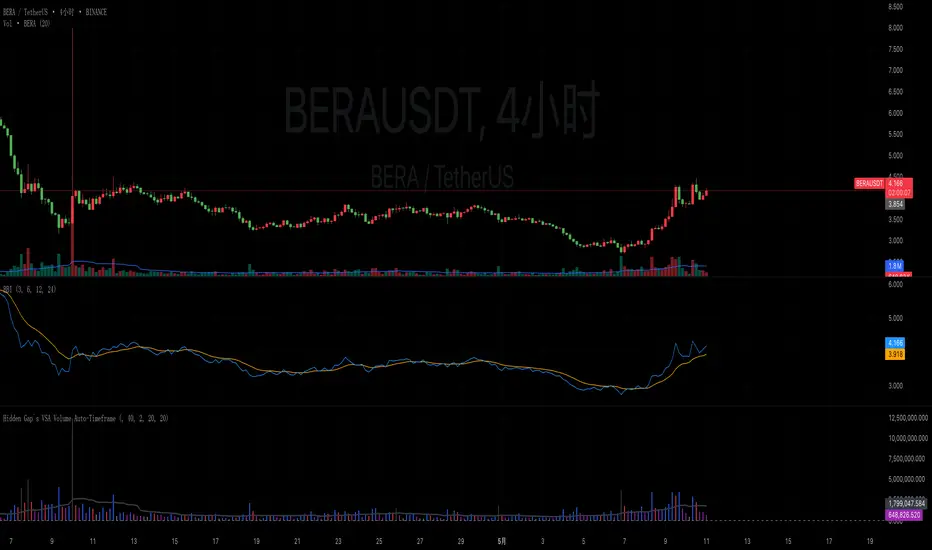
Big Whale Finder PROBig Whale Finder PRO
The Big Whale Finder PRO is an advanced technical indicator designed to detect and analyze the footprints of institutional traders (commonly referred to as "whales") in financial markets. Based on multiple proprietary detection algorithms, this indicator identifies distinct patterns of accumulation and distribution that typically occur when large market participants execute significant orders.
Theoretical Framework
The indicator builds upon established market microstructure theories and empirical research on institutional trading behavior. As Kyle (1985) demonstrated in his seminal work on market microstructure, informed traders with large positions tend to execute their orders strategically to minimize market impact. This often results in specific volume and price action patterns that the Big Whale Finder PRO is designed to detect.
Key Feature Enhancements
1. Volume Analysis Refinement
The indicator implements a dual-threshold approach to volume analysis based on research by Easley et al. (2012) on volume-based informed trading metrics. The normal threshold identifies routine institutional activity, while the extreme threshold flags exceptional events that often precede significant market moves.
2. Wickbody Ratio Analysis
Drawing from Cao et al. (2021) research on price formation and order flow imbalance, the indicator incorporates wick-to-body ratio analysis to detect potential order absorption and iceberg orders. High wick-to-body ratios often indicate hidden liquidity and resistance/support levels maintained by large players.
3. BWF-Index (Proprietary Metric)
The BWF-Index is a novel quantitative measure that combines volume anomalies, price stagnation, and candle morphology into a single metric. This approach draws from Harris's (2003) work on trading and exchanges, which suggests that institutional activity often manifests through multiple simultaneous market microstructure anomalies.
4. Zone Tracking System
Based on Wyckoff Accumulation/Distribution methodology and modern zone detection algorithms, the indicator establishes and tracks zones where institutional activity has occurred. This feature enables traders to identify potential support/resistance areas where large players have previously shown interest.
5. Trend Integration
Following Lo and MacKinlay's (1988) work on market efficiency and technical analysis, the indicator incorporates trend analysis through dual EMA comparison, providing context for volume and price patterns.
Labels and Signals Explanation
The indicator uses a system of labels to mark significant events on the chart:
🐋 (Whale Symbol): Indicates extreme volume activity that significantly exceeds normal market participation. This is often a sign of major institutional involvement and frequently precedes significant price moves. The presence of this label suggests heightened attention is warranted as a potential trend reversal or acceleration may be imminent.
A (Accumulation): Marks periods where large players are likely accumulating positions. This is characterized by high volume, minimal price movement upward, and stronger support at the lower end of the candle (larger lower wicks). Accumulation zones often form bases for future upward price movements. This pattern frequently occurs at the end of downtrends or during consolidation phases before uptrends.
D (Distribution): Identifies periods where large players are likely distributing (selling) their positions. This pattern shows high volume, minimal downward price movement, and stronger resistance at the upper end of the candle (larger upper wicks). Distribution zones often form tops before downward price movements. This pattern typically appears at the end of uptrends or during consolidation phases before downtrends.
ICE (Iceberg Order): Flags the potential presence of iceberg orders, where large orders are split into smaller visible portions to hide the true size. These are characterized by unusual wick-to-body ratios with high volume. Iceberg orders often indicate price levels that large institutions consider significant and may act as strong support or resistance areas.
Information Panel Interpretation
The information panel provides real-time analysis of market conditions:
Volume/Average Ratio: Shows how current volume compares to the historical average. Values above the threshold (default 1.5x) indicate abnormal activity that may signal institutional involvement.
BWF-Index: A proprietary metric that quantifies potential whale activity. Higher values (especially >10) indicate stronger likelihood of institutional participation. The BWF-Index combines volume anomalies, price action characteristics, and candle morphology to provide a single measure of potential whale activity.
Status: Displays the current market classification based on detected patterns:
"Major Whale Activity": Extreme volume detected, suggesting significant institutional involvement
"Accumulation": Potential buying activity by large players
"Distribution": Potential selling activity by large players
"High Volume": Above-average volume without clear accumulation/distribution patterns
"Normal": Regular market activity with no significant institutional footprints
Trend: Shows the current market trend based on EMA comparison:
"Uptrend": Fast EMA above Slow EMA, suggesting bullish momentum
"Downtrend": Fast EMA below Slow EMA, suggesting bearish momentum
"Sideways": EMAs very close together, suggesting consolidation
Zone: Indicates if the current price is in a previously identified institutional activity zone:
"In Buy Zone": Price is in an area where accumulation was previously detected
"In Sell Zone": Price is in an area where distribution was previously detected
"Neutral": Price is not in a previously identified institutional zone
Trading Recommendations
Based on the different signals and patterns, the following trading recommendations apply:
Bullish Scenarios
Accumulation (A) + Uptrend: Strong buy signal. Large players are accumulating in an established uptrend, suggesting potential continuation or acceleration.
Strategy: Consider entering long positions with stops below the accumulation zone.
Extreme Volume (🐋) + In Buy Zone + Price Above EMAs: Very bullish. Major whale activity in a previously established buying zone with positive price action.
Strategy: Aggressive buying opportunity with wider stops to accommodate volatility.
High BWF-Index (>10) + Accumulation + Downtrend Ending: Potential trend reversal signal. High institutional interest at the potential end of a downtrend.
Strategy: Early position building with tight risk management until trend confirmation.
Bearish Scenarios
Distribution (D) + Downtrend: Strong sell signal. Large players are distributing in an established downtrend, suggesting potential continuation or acceleration.
Strategy: Consider entering short positions with stops above the distribution zone.
Extreme Volume (🐋) + In Sell Zone + Price Below EMAs: Very bearish. Major whale activity in a previously established selling zone with negative price action.
Strategy: Aggressive shorting opportunity with wider stops to accommodate volatility.
High BWF-Index (>10) + Distribution + Uptrend Ending: Potential trend reversal signal. High institutional interest at the potential end of an uptrend.
Strategy: Early short position building with tight risk management until trend confirmation.
Neutral/Caution Scenarios
Iceberg Orders (ICE) + Sideways Market: Suggests significant hidden liquidity at current levels.
Strategy: Mark these levels as potential support/resistance for future reference. Consider range-trading strategies.
Conflicting Signals (e.g., Accumulation in Downtrend): Requires careful analysis.
Strategy: Wait for additional confirmation or reduce position sizing.
Multiple Extreme Volume Events (🐋) in Succession: Indicates unusual market conditions, possibly related to news events or major market shifts.
Strategy: Exercise extreme caution and potentially reduce exposure until clarity emerges.
Practical Applications
Short-Term Trading:
Use the indicator to identify institutional activity zones for potential intraday support/resistance levels
Watch for whale symbols (🐋) to anticipate potential volatility or trend changes
Combine with price action analysis for entry/exit timing
Swing Trading
Focus on accumulation/distribution patterns in conjunction with the prevailing trend
Use buy/sell zones as areas to establish or exit positions
Monitor the BWF-Index for increasing institutional interest over time
Position Trading
Track long-term whale activity to identify shifts in institutional positioning
Use multiple timeframe analysis to confirm major accumulation/distribution phases
Combine with fundamental analysis to validate potential long-term trend changes
References
Kyle, A. S. (1985). Continuous auctions and insider trading. Econometrica, 53(6), 1315-1335.
Easley, D., López de Prado, M. M., & O'Hara, M. (2012). Flow toxicity and liquidity in a high-frequency world. The Review of Financial Studies, 25(5), 1457-1493.
Cao, C., Hansch, O., & Wang, X. (2021). The information content of an open limit order book. Journal of Financial Markets, 50, 100561.
Harris, L. (2003). Trading and exchanges: Market microstructure for practitioners. Oxford University Press.
Lo, A. W., & MacKinlay, A. C. (1988). Stock market prices do not follow random walks: Evidence from a simple specification test. The Review of Financial Studies, 1(1), 41-66.
Wyckoff, R. D. (1931). The Richard D. Wyckoff method of trading and investing in stocks. Transaction Publishers.
Menkhoff, L., & Taylor, M. P. (2007). The obstinate passion of foreign exchange professionals: Technical analysis. Journal of Economic Literature, 45(4), 936-972.

C&B Auto MK5C&B Auto MK5.2ema BullBear
Overview
The C&B Auto MK5.2ema BullBear is a versatile Pine Script indicator designed to help traders identify bullish and bearish market conditions across various timeframes. It combines Exponential Moving Averages (EMAs), Relative Strength Index (RSI), Average True Range (ATR), and customizable time filters to generate actionable signals. The indicator overlays on the price chart, displaying EMAs, a dynamic cloud, scaled RSI levels, bull/bear signals, and market condition labels, making it suitable for swing trading, day trading, or scalping in trending or volatile markets.
What It Does
This indicator generates bull and bear signals based on the interaction of two EMAs, filtered by RSI thresholds, ATR-based volatility, a 50/200 EMA trend filter, and user-defined time windows. It adapts to market volatility by adjusting EMA lengths and RSI thresholds. A dynamic cloud highlights trend direction or neutral zones, with candlestick coloring in neutral conditions. Market condition labels (current and historical) provide real-time trend and volatility context, displayed above the chart.
How It Works
The indicator uses the following components:
EMAs: Two EMAs (short and long) are calculated on a user-selected timeframe (1, 5, 15, 30, or 60 minutes). Their crossover or crossunder triggers potential bull/bear signals. EMA lengths adjust based on volatility (e.g., 10/20 for volatile markets, 5/10 for non-volatile).
Dynamic Cloud: The area between the EMAs forms a cloud, colored green for bullish trends, red for bearish trends, or a user-defined color (default yellow) for neutral zones (when EMAs are close, determined by an ATR-based threshold). Users can widen the cloud for visibility.
RSI Filter: RSI is scaled to price levels and plotted on the chart (optional). Signals are filtered to ensure RSI is within volatility-adjusted bull/bear thresholds and not in overbought/oversold zones.
ATR Volatility Filter: An optional filter ensures signals occur during sufficient volatility (ATR(14) > SMA(ATR, 20)).
50/200 EMA Trend Filter: An optional filter restricts bull signals to bullish trends (50 EMA > 200 EMA) and bear signals to bearish trends (50 EMA < 200 EMA).
Time Filter: Signals are restricted to a user-defined UTC time window (default 9:00–15:00), aligning with active trading sessions.
Market Condition Labels: Labels above the chart display the current trend (Bullish, Bearish, Neutral) and optionally volatility (e.g., “Bullish Volatile”). Up to two historical labels persist for a user-defined number of bars (default 5) to show recent trend changes.
Visual Aids: Bull signals appear as green triangles/labels below the bar, bear signals as red triangles/labels above. Candlesticks in neutral zones are colored (default yellow).
The indicator ensures compatibility with standard chart types (e.g., candlestick or bar charts) to produce realistic signals, avoiding non-standard types like Heikin Ashi or Renko.
How to Use It
Add to Chart: Apply the indicator to a candlestick or bar chart on TradingView.
Configure Settings:
Timeframe: Choose a timeframe (1, 5, 15, 30, or 60 minutes) to match your trading style.
Filters:
Enable/disable the ATR volatility filter to focus on high-volatility periods.
Enable/disable the 50/200 EMA trend filter to align signals with the broader trend.
Enable the time filter and set custom UTC hours/minutes (default 9:00–15:00).
Cloud Settings: Adjust the cloud width, neutral zone threshold, color, and transparency.
EMA Colors: Use default trend-based colors or set custom colors for short/long EMAs.
RSI Display: Toggle the scaled RSI and its thresholds, with customizable colors.
Signal Settings: Toggle bull/bear labels and set signal colors.
Market Condition Labels: Toggle current/historical labels, include/exclude volatility, and adjust decay period.
Interpret Signals:
Bull Signal: A green triangle or “Bull” label below the bar indicates potential bullish momentum (EMA crossover, RSI above bull threshold, within time window, passing filters).
Bear Signal: A red triangle or “Bear” label above the bar indicates potential bearish momentum (EMA crossunder, RSI below bear threshold, within time window, passing filters).
Neutral Zone: Yellow candlesticks and cloud (if enabled) suggest a lack of clear trend; consider range-bound strategies or avoid trading.
Market Condition Labels: Check labels above the chart for real-time trend (Bullish, Bearish, Neutral) and volatility status to confirm market context.
Monitor Context: Use the cloud, RSI, and labels to assess trend strength and volatility before acting on signals.
Unique Features
Volatility-Adaptive EMAs: Automatically adjusts EMA lengths based on ATR to suit volatile or non-volatile markets, reducing manual configuration.
Neutral Zone Detection: Uses an ATR-based threshold to identify low-trend periods, helping traders avoid choppy markets.
Scaled RSI Visualization: Plots RSI and thresholds directly on the price chart, simplifying momentum analysis relative to price.
Flexible Time Filtering: Supports precise UTC-based trading windows, ideal for day traders targeting specific sessions.
Historical Market Labels: Displays recent trend changes (up to two) with a decay period, providing context for market shifts.
50/200 EMA Trend Filter: Aligns signals with the broader market trend, enhancing signal reliability.
Notes
Use on standard candlestick or bar charts to ensure accurate signals.
Test the indicator on a demo account to optimize settings for your market and timeframe.
Combine with other analysis (e.g., support/resistance, volume) for better decision-making.
The indicator is not a standalone system; use it as part of a broader trading strategy.
Limitations
Signals may lag in fast-moving markets due to EMA-based calculations.
Neutral zone detection may vary in extremely volatile or illiquid markets.
Time filters are UTC-based; ensure your platform’s timezone settings align.
This indicator is designed for traders seeking a customizable, trend-following tool that adapts to volatility and provides clear visual cues with robust filtering for bullish and bearish market conditions.

AlphaTrend++AlphaTrend++
Overview
The AlphaTrend++ is an advanced Pine Script indicator designed to help traders identify buy and sell opportunities in trending and volatile markets. Building on trend-following principles, it uses a modified Average True Range (ATR) calculation combined with volume or momentum data to plot a dynamic trend line. The indicator overlays on the price chart, displaying a colored trend line, a filled trend zone, buy/sell signals, and optional stop-loss tick labels, making it ideal for day trading or swing trading, particularly in markets like futures (e.g., MES).
What It Does
This indicator generates buy and sell signals based on the direction and momentum of a custom trend line, filtered by optional time restrictions and signal frequency logic. The trend line adapts to price action and volatility, with a filled zone highlighting trend strength. Buy/sell signals are plotted as labels, and stop-loss distances are displayed in ticks (customizable for instruments like MES). The indicator supports standard chart types for realistic signal generation.
How It Works
The indicator employs the following components:
Trend Line Calculation: A dynamic trend line is calculated using ATR adjusted by a user-defined multiplier, combined with either Money Flow Index (MFI) or Relative Strength Index (RSI) depending on volume availability. The line tracks price movements, adjusting upward or downward based on trend direction and volatility.
Trend Zone: The area between the current trend line and its value two bars prior is filled, colored green for bullish trends (upward movement) or red for bearish trends (downward movement), providing a visual cue of trend strength.
Signal Generation: Buy signals occur when the trend line crosses above its value two bars ago, and sell signals occur when it crosses below, with optional filtering to reduce signal noise (based on bar timing logic). Signals can be restricted to a 9:00–15:00 UTC trading window.
Stop-Loss Ticks: For each signal, the indicator calculates the distance to the trend line (acting as a stop-loss level) in ticks, using a user-defined tick size (default 0.25 for MES). These are displayed as labels below/above the signal.
Time Filter: An optional filter limits signals to 9:00–15:00 UTC, aligning with active trading sessions like the US market open.
The indicator ensures compatibility with standard chart types (e.g., candlestick or bar charts) to avoid unrealistic results associated with non-standard types like Heikin Ashi or Renko.
How to Use It
Add to Chart: Apply the indicator to a candlestick or bar chart on TradingView.
Configure Settings:
Multiplier: Adjust the ATR multiplier (default 1.0) to control trend line sensitivity. Higher values widen the stop-loss distance.
Common Period: Set the ATR and MFI/RSI period (default 14) for trend calculations.
No Volume Data: Enable if volume data is unavailable (e.g., for certain forex pairs), switching from MFI to RSI.
Tick Size: Set the tick size for stop-loss calculations (default 0.25 for MES futures).
Show Buy/Sell Signals: Toggle signal labels (default enabled).
Show Stop Loss Ticks: Toggle stop-loss tick labels (default enabled).
Use Time Filter: Restrict signals to 9:00–15:00 UTC (default disabled).
Use Filtered Signals: Enable to reduce signal frequency using bar timing logic (default enabled).
Interpret Signals:
Buy Signal: A blue “BUY” label below the bar indicates a potential long entry (trend line crossover, passing filters).
Sell Signal: A red “SELL” label above the bar indicates a potential short entry (trend line crossunder, passing filters).
Trend Zone: Green fill suggests bullish momentum; red fill suggests bearish momentum.
Stop-Loss Ticks: Gray labels show the stop-loss distance in ticks, helping with risk management.
Monitor Context: Use the trend line and filled zone to confirm the market’s direction before acting on signals.
Unique Features
Adaptive Trend Line: Combines ATR with MFI or RSI to create a responsive trend line that adjusts to volatility and market conditions.
Tick-Based Stop-Loss: Displays stop-loss distances in ticks, customizable for specific instruments, aiding precise risk management.
Signal Filtering: Optional bar timing logic reduces false signals, improving reliability in choppy markets.
Trend Zone Visualization: The filled zone between trend line values enhances trend clarity, making it easier to assess momentum.
Time-Restricted Trading: Optional 9:00–15:00 UTC filter aligns signals with high-liquidity sessions.
Notes
Use on standard candlestick or bar charts to ensure accurate signals.
Test the indicator on a demo account to optimize settings for your market and timeframe.
Combine with other analysis (e.g., support/resistance, volume spikes) for better decision-making.
The indicator is not a standalone system; use it as part of a broader trading strategy.
Limitations
Signals may lag in highly volatile or low-liquidity markets due to ATR-based calculations.
The 9:00–15:00 UTC time filter may not suit all markets; disable it for 24-hour assets like forex or crypto.
Stop-loss tick calculations assume consistent tick sizes; verify compatibility with your instrument.
This indicator is designed for traders seeking a robust, trend-following tool with customizable risk management and signal filtering, optimized for active trading sessions.

PowerHouse SwiftEdge AI v2.10 with Custom Filters & AI AnalysisPowerHouse SwiftEdge AI v2.10 with Custom Filters & AI Analysis
Overview
PowerHouse SwiftEdge AI v2.10 is an advanced TradingView Pine Script indicator designed to identify high-probability trading setups by combining pivot-based structure analysis, multi-timeframe trend detection, and adaptive AI-driven signal filtering. The script integrates Change of Character (CHoCH) and Break of Structure (BOS) signals with customizable momentum, volume, breakout, and trend filters to enhance trade precision. Additionally, it offers an optional AI Market Analysis module that predicts future price trends across multiple timeframes, providing traders with a comprehensive market outlook.
The script is highly customizable, allowing users to tailor inputs to their trading style, whether for scalping, swing trading, or long-term strategies. It is suitable for all asset classes, including stocks, forex, crypto, and commodities, and performs optimally on timeframes ranging from 1-minute to daily charts.
Key Features
Pivot-Based Signal Generation:
Identifies pivot highs and lows to detect CHoCH (reversal patterns) and BOS (continuation patterns).
Signals are plotted as "Buy" or "Sell" labels with optional "Get Ready" pre-signals to prepare traders for potential setups.
Take-profit (TP) levels are automatically calculated based on user-defined points, with optional TP box visualization.
Multi-Timeframe Trend Analysis:
Analyzes trends across seven timeframes (1M, 5M, 15M, 30M, 1H, 4H, D) using EMA and VWAP to determine bullish, bearish, or neutral conditions.
Displays a futuristic AI-Trend Matrix dashboard showing trend direction, strength, and confidence levels for quick decision-making.
Customizable Signal Filters:
Momentum Filter: Ensures signals align with significant price changes, adjusted dynamically using ATR-based volatility.
Higher Timeframe Trend Filter: Requires signals to align with the trend of a user-selected higher timeframe (e.g., 1H).
Lower Timeframe Trend Filter: Prevents signals that conflict with the trend of a user-selected lower timeframe (e.g., 5M).
Volume Filter: Optionally requires above-average volume to confirm signals.
Breakout Filter: Optionally requires price to break previous highs/lows for signal validation.
Repeated Signal Restriction: Prevents consecutive signals in the same trend direction until the trend changes on a user-defined timeframe.
AI-Driven Adaptivity:
Incorporates Cumulative Volume Delta (CVD) to assess buying/selling pressure and classify market volatility (Low, Medium, High).
Uses ATR to dynamically adjust momentum thresholds, ensuring signals adapt to current market conditions.
Optional AI Market Analysis module predicts trends across multiple timeframes by combining trend, momentum, and volatility scores.
Visual Elements:
Plots CHoCH and BOS levels as horizontal lines with distinct colors (aqua for CHoCH sell, lime for CHoCH buy, fuchsia for BOS sell, teal for BOS buy).
Draws dynamic support and resistance trendlines based on short and long-term price action, colored by trend strength.
Displays TP levels and pivot highs/lows for easy reference.
How It Works
The script combines several technical analysis concepts to create a robust trading system:
Market Structure Analysis:
Pivot highs and lows are identified using a user-defined lookback period (Pivot Length).
CHoCH occurs when price crosses below a pivot high (bearish reversal) or above a pivot low (bullish reversal).
BOS occurs when price breaks a previous pivot low (bearish continuation) or pivot high (bullish continuation).
Trend and Momentum Integration:
Trends are determined by comparing price to EMA and VWAP on multiple timeframes.
Momentum is calculated as the percentage price change, with thresholds adjusted by ATR to account for volatility.
"Get Ready" signals appear when momentum approaches the threshold, preparing traders for potential CHoCH or BOS signals.
Signal Filtering:
Filters ensure signals align with user-defined criteria (e.g., trend direction, volume, breakouts).
The Restrict Repeated Signals option prevents over-signaling by requiring a trend change on a specified timeframe before generating a new signal in the same direction.
AI Market Analysis:
The optional AI module calculates a score for each timeframe based on trend direction, momentum, and volatility (ATR compared to its SMA).
Scores are translated into predictions (▲ for bullish, ▼ for bearish, — for neutral), displayed in a dedicated table.
CVD and Volatility Context:
CVD tracks buying vs. selling pressure by accumulating volume based on price direction.
Volatility is classified using CVD magnitude, influencing the script’s visual cues and signal sensitivity.
Why This Combination?
The integration of pivot-based structure analysis, multi-timeframe trend filtering, and AI-driven adaptivity addresses common trading challenges:
Precision: CHoCH and BOS signals focus on key market turning points, reducing noise from minor price fluctuations.
Context: Multi-timeframe analysis ensures trades align with broader market trends, improving win rates.
Adaptivity: ATR and CVD adjustments make the script responsive to changing market conditions, avoiding static thresholds that fail in volatile or quiet markets.
Customization: Extensive input options allow traders to adapt the script to their preferred markets, timeframes, and risk profiles.
Predictive Insight: The AI Market Analysis module provides forward-looking trend predictions, helping traders anticipate market moves.
This combination creates a self-contained system that balances responsiveness with reliability, making it suitable for both novice and experienced traders.
How to Use
Add to Chart:
Apply the indicator to your TradingView chart for any asset and timeframe.
Recommended timeframes: 5M to 1H for scalping/day trading, 4H to D for swing trading.
Configure Inputs:
Pivot Length: Adjust (default 5) to control sensitivity to pivot highs/lows. Lower values for faster signals, higher for stronger confirmations.
Momentum Threshold: Set the minimum price change (default 0.01%) for signals. Increase for stricter conditions.
Take Profit Points: Define TP distance (default 10 points). Adjust based on asset volatility.
Signal Filters: Enable/disable filters (momentum, trend, volume, breakout) to match your strategy.
Higher/Lower Timeframe: Select timeframes for trend alignment (e.g., 1H for higher, 5M for lower).
AI Market Analysis: Enable for predictive trend insights across timeframes.
Get Ready Signals: Enable to see pre-signals for potential setups.
Interpret Signals:
Buy/Sell Labels: Act on green "Buy" or red "Sell" labels, confirming with TP levels and trend direction.
Get Ready Labels: Yellow "Get Ready BUY" or orange "Get Ready SELL" indicate potential setups; prepare but wait for confirmation.
CHoCH/BOS Lines: Use aqua/lime (CHoCH) and fuchsia/teal (BOS) lines as key support/resistance levels.
AI-Trend Matrix: Check the top-right dashboard for trend strength (%), confidence (%), and timeframe-specific trends.
AI Market Analysis Table: If enabled, view predictions (▲/▼/—) for each timeframe to anticipate market direction.
Trading Tips:
Combine signals with other indicators (e.g., RSI, MACD) for additional confirmation.
Use higher timeframe trend alignment for higher-probability trades.
Adjust TP and signal distance based on asset volatility and trading style.
Monitor the AI-Trend Matrix for trend strength; values above 50% or below -50% indicate strong directional bias.
Originality
PowerHouse SwiftEdge AI v2.10 stands out due to its unique blend of:
Adaptive Signal Generation: ATR-based momentum thresholds and CVD-driven volatility context ensure signals remain relevant across market conditions.
Multi-Timeframe Synergy: The script’s ability to filter signals based on both higher and lower timeframe trends provides a rare balance of precision and context.
AI-Powered Insights: The AI Market Analysis module offers predictive capabilities not commonly found in traditional indicators, simulating institutional-grade analysis.
Visual Clarity: The futuristic dashboard and color-coded trendlines make complex data accessible, enhancing usability for all trader levels.
Unlike standalone pivot or trend indicators, this script integrates multiple layers of analysis into a cohesive system, reducing false signals and providing actionable insights without requiring external tools or research.
Limitations
False Signals: No indicator is foolproof; signals may fail in choppy or low-volume markets. Use filters to mitigate.
Timeframe Sensitivity: Performance varies by timeframe and asset. Test settings thoroughly.
AI Predictions: The AI Market Analysis is based on historical data and simplified scoring; it’s not a guaranteed forecast.
Resource Usage: Enabling all filters and AI analysis may slow performance on lower-end devices.

Williams Fractals Dynamic Horizontal LinesWilliams Fractals with Dynamic Horizontal Lines
Overview
This script identifies Williams Fractals (support and resistance points) on any chart and automatically draws horizontal lines at those fractal levels.
The lines extend right and disappear when price breaks them — giving a clean and real-time view of key support and resistance levels.
Features
Detects upward fractals (potential resistances).
Detects downward fractals (potential supports).
Draws horizontal lines at each fractal point.
Automatically deletes a line when:
Price closes above a resistance.
Price closes below a support.
Clean and lightweight — minimal performance impact.
Inputs
Setting Description Default
Periods (n) Number of candles on each side required to confirm a fractal (minimum 2). 2
How It Works
Fractal Detection:
An up fractal is confirmed when a candle has the highest high compared to its neighbors.
A down fractal is confirmed when a candle has the lowest low compared to its neighbors.
Custom logic supports different "ties" — not just strict greater-than or less-than comparisons.
Drawing Lines:
When an up fractal is detected → a red horizontal resistance line is drawn.
When a down fractal is detected → a green horizontal support line is drawn.
Lines are drawn starting at the fractal candle and extend right across the chart.
Dynamic Line Deletion:
Every new candle is checked:
If high > resistance line → delete that resistance line.
If low < support line → delete that support line.
Only unbroken lines are kept on the chart, providing live, updated support/resistance zones.
Visual Elements
Up Fractal: 🡅 Triangular marker (teal color) above the fractal candle.
Down Fractal: 🡇 Triangular marker (red color) below the fractal candle.
Resistance Line: Red horizontal line.
Support Line: Green horizontal line.
Technical Details
Version: Pine Script v6
Arrays Used:
To store and manage active lines (line arrays).
To track the price associated with each line (float arrays).
Error Handling:
Backward iteration is handled using a while loop instead of a for loop to comply with Pine Script restrictions.
Offset Handling:
Fractal markers are plotted with an offset of -n bars for visual alignment.
Possible Enhancements (Future Ideas)
Sensitivity Settings: Allow a small margin (buffer) to define breakouts.
Extend Options: Let users choose between extending "infinite" or "limited" bars.
Custom Alerts: Generate alerts when fractal levels are broken.
Multi-timeframe Support: Detect fractals from higher timeframes on lower timeframe charts.
Example Usage
Swing Trading:
Use the fractal lines to identify and react to key breakouts or breakdowns dynamically.
Intraday Trading:
Spot live support/resistance on smaller timeframes for quick trades.
Trend Reversal Spotting:
Notice when a major fractal level is broken, possibly indicating trend changes.
Example Visual — Williams Fractals Dynamic Lines
Price Chart View:
What This Diagram Shows:
▲ Up Fractals:
Form resistance lines.
Line extends until price breaks above it.
▼ Down Fractals:
Form support lines.
Line extends until price breaks below it.
Lines are removed from the chart as soon as broken.
📈 Real Chart Example
Here's a rough idea how it will look live on your TradingView chart:
Feature Visual
Up Fractal 🔺 Green triangle above bar
Resistance Line ➖ Horizontal red line across the chart
Down Fractal 🔻 Red triangle below bar
Support Line ➖ Horizontal green line across the chart
Line Break 🚫 Line disappears when price crosses
CyberCandle SwiftEdgeCyberCandle SwiftEdge
Overview
CyberCandle SwiftEdge is a cutting-edge, AI-inspired trading indicator designed for traders seeking precision and clarity in trend-following and swing trading. Powered by SwiftEdge, it combines Heikin Ashi candles, a gradient-colored Exponential Moving Average (EMA), and a Relative Strength Index (RSI) to deliver clear buy and sell signals. Featuring glowing visuals, dynamic signal icons, and a customizable RSI dashboard in the top-right corner, this script offers a futuristic interface for identifying high-probability trade setups on various timeframes (e.g., 1H, 4H).
What It Does
CyberCandle SwiftEdge integrates three powerful components to generate actionable trading signals:
Heikin Ashi Candles: Smooths price action to highlight trends, reducing market noise and making reversals easier to spot.
Gradient EMA: A 100-period EMA with dynamic color transitions (blue/cyan for uptrends, red/pink for downtrends) to confirm market direction.
RSI Dashboard: A neon-lit display showing RSI levels, indicating overbought (>70), oversold (<30), or neutral (30-70) conditions.
Buy and sell signals are marked with prominent, glowing icons (triangles and arrows) based on trend direction, momentum, and specific Heikin Ashi patterns. The script’s customizable parameters allow traders to tailor the strategy to their preferences, balancing signal frequency and precision.
How It Works
The strategy leverages the synergy of Heikin Ashi, EMA, and RSI to filter trades and highlight opportunities:
Trend Direction: The price must be above the EMA for buy signals (bullish trend) or below for sell signals (bearish trend). The EMA’s gradient color shifts based on its slope, visually reinforcing trend strength.
Momentum Confirmation: RSI must exceed a user-defined threshold (default: 50) for buy signals or fall below it for sell signals, ensuring momentum supports the trade.
Candle Patterns: Buy signals require a green Heikin Ashi candle (close > open), with the two prior candles having minimal upper wicks (≤5% of candle body) and being red (indicating a retracement). Sell signals require a red candle, minimal lower wicks, and two prior green candles.
RSI Dashboard: Positioned in the top-right corner, it features a glowing circle (red for overbought, green for oversold, blue for neutral), the current RSI value, and a status indicator (triangle for extremes, square for neutral). This provides instant momentum insights without cluttering the chart.
By combining Heikin Ashi’s trend clarity, EMA’s directional filter, and RSI’s momentum validation, CyberCandle SwiftEdge minimizes false signals and highlights trades with strong potential. Its vibrant, AI-like visuals make it easy to interpret at a glance.
How to Use It
Add to Chart: In TradingView, search for "CyberCandle SwiftEdge" and add it to your chart. Set the chart to Heikin Ashi candles for optimal compatibility.
Interpret Signals:
Buy Signal: Large green triangles and arrows appear below candles when the price is above the EMA, RSI is above the buy threshold (default: 50), and conditions for a bullish retracement are met. Consider entering a long position with a 1:2 risk/reward ratio.
Sell Signal: Large red triangles and arrows appear above candles when the price is below the EMA, RSI is below the sell threshold (default: 50), and conditions for a bearish retracement are met. Consider entering a short position.
RSI Dashboard: Monitor the top-right dashboard. A red circle (RSI > 70) suggests caution for buys, a green circle (RSI < 30) indicates potential buying opportunities, and a blue circle (RSI 30-70) signals neutrality.
Customize Parameters: Open the indicator’s settings to adjust:
EMA Length (default: 100): Increase (e.g., 200) for longer-term trends or decrease (e.g., 50) for shorter-term sensitivity.
RSI Length (default: 14): Adjust for more (e.g., 7) or less (e.g., 21) responsive momentum signals.
RSI Buy/Sell Thresholds (default: 50): Set higher (e.g., 55) for buys or lower (e.g., 45) for sells to require stronger momentum.
Wick Tolerance (default: 0.05): Increase (e.g., 0.1) to allow larger wicks, generating more signals, or decrease (e.g., 0.02) for stricter conditions.
Require Retracement (default: true): Disable to remove the two-candle retracement requirement, increasing signal frequency.
Trading: Use signals in conjunction with the RSI dashboard and market context. For example, avoid buy signals if the RSI dashboard is red (overbought). Always apply proper risk management, such as setting stop-losses based on recent lows/highs.
What Makes It Original
CyberCandle SwiftEdge stands out due to its futuristic, AI-inspired visual design and user-friendly customization:
Neon Aesthetics: Glowing Heikin Ashi candles, gradient EMA, and dynamic signal icons (triangles and arrows) with RSI-driven transparency create a high-tech, immersive experience.
RSI Dashboard: A compact, top-right display with a neon circle, RSI value, and adaptive status indicator (triangle/square) provides instant momentum insights without cluttering the chart.
Customizability: Users can fine-tune EMA length, RSI parameters, wick tolerance, and retracement requirements via TradingView’s settings, balancing signal frequency and precision.
Integrated Approach: The synergy of Heikin Ashi’s trend clarity, EMA’s directional strength, and RSI’s momentum validation offers a cohesive strategy that reduces false signals.
Why This Combination?
The script combines Heikin Ashi, EMA, and RSI for a complementary effect:
Heikin Ashi smooths price fluctuations, making it ideal for identifying sustained trends and retracements, which are critical for the strategy’s signal logic.
EMA provides a reliable trend filter, ensuring signals align with the broader market direction. Its gradient color enhances visual trend recognition.
RSI adds momentum context, confirming that signals occur during favorable conditions (e.g., RSI > 50 for buys). The dashboard makes RSI intuitive, even for non-technical users.
Together, these components create a balanced system that captures trend reversals after retracements, validated by momentum, with a visually engaging interface that simplifies decision-making.
Tips
Best used on volatile assets (e.g., BTC/USD, EUR/USD) and higher timeframes (1H, 4H) for clearer trends.
Experiment with parameters in the settings to match your trading style (e.g., increase wick tolerance for more signals).
Combine with other analysis (e.g., support/resistance) for higher-confidence trades.
Note
This indicator is for informational purposes and does not guarantee profits. Always backtest and use proper risk management before trading.

Easy MA SignalsEasy MA Signals
Overview
Easy MA Signals is a versatile Pine Script indicator designed to help traders visualize moving average (MA) trends, generate buy/sell signals based on crossovers or custom price levels, and enhance chart analysis with volume-based candlestick coloring. Built with flexibility in mind, it supports multiple MA types, crossover options, and customizable signal appearances, making it suitable for traders of all levels. Whether you're a day trader, swing trader, or long-term investor, this indicator provides actionable insights while keeping your charts clean and intuitive.
Configure the Settings
The indicator is divided into three input groups for ease of use:
General Settings:
Candlestick Color Scheme: Choose from 10 volume-based color schemes (e.g., Sapphire Pulse, Emerald Spark) to highlight high/low volume candles. Select “None” for TradingView’s default colors.
Moving Average Length: Set the MA period (default: 20). Adjust for faster (lower values) or slower (higher values) signals.
Moving Average Type: Choose between SMA, EMA, or WMA (default: EMA).
Show Buy/Sell Signals: Enable/disable signal plotting (default: enabled).
Moving Average Crossover: Select a crossover type (e.g., MA vs VWAP, MA vs SMA50) for signals or “None” to disable.
Volume Influence: Adjust how volume impacts candlestick colors (default: 1.2). Higher values make thresholds stricter.
Signal Appearance Settings:
Buy/Sell Signal Shape: Choose shapes like triangles, arrows, or labels for signals.
Buy/Sell Signal Position: Place signals above or below bars.
Buy/Sell Signal Color: Customize colors for better visibility (default: green for buy, red for sell).
Custom Price Alerts:
Custom Buy/Sell Alert Price: Set specific price levels for alerts (default: 0, disabled). Enter a non-zero value to enable.
Set Up Alerts
To receive notifications (e.g., sound, popup, email) when signals or custom price levels are hit:
Click the Alert button (alarm clock icon) in TradingView.
Select Easy MA Signals as the condition and choose one of the four alert types:
MA Crossover Buy Alert: Triggers on MA crossover buy signals.
MA Crossover Sell Alert: Triggers on MA crossover sell signals.
Custom Buy Alert: Triggers when price crosses above the custom buy price.
Custom Sell Alert: Triggers when price crosses below the custom sell price.
Enable Play Sound and select a sound (e.g., “Bell”).
Set the frequency (e.g., Once Per Bar Close for confirmed signals) and create the alert.
Analyze the Chart
Moving Average Line: Displays the selected MA with color changes (green for bullish, red for bearish, gray for neutral) based on price position relative to the MA.
Buy/Sell Signals: Appear as shapes or labels when crossovers or custom price levels are hit.
Candlestick Colors: If a color scheme is selected, candles change color based on volume strength (high, low, or neutral), aiding in trend confirmation.
Why Use Easy MA Signals?
Easy MA Signals is designed to simplify technical analysis while offering advanced customization. It’s ideal for traders who want:
A clear visualization of MA trends and crossovers.
Flexible signal generation based on MA crossovers or custom price levels.
Volume-enhanced candlestick coloring to identify market strength.
Easy-to-use settings with tooltips for beginners and pros alike.
This script is particularly valuable because it combines multiple features into one indicator, reducing chart clutter and providing actionable insights without overwhelming the user.
Benefits of Easy MA Signals
Highly Customizable: Supports SMA, EMA, and WMA with adjustable lengths.
Offers multiple crossover options (VWAP, SMA10, SMA20, etc.) for tailored strategies.
Custom price alerts allow precise targeting of key levels.
Volume-Based Candlestick Coloring: 10 unique color schemes highlight volume strength, helping traders confirm trends.
Adjustable volume influence ensures adaptability to different markets.
Flexible Signal Visualization: Choose from various signal shapes (triangles, arrows, labels) and positions (above/below bars).
Customizable colors improve visibility on any chart background.
Alert Integration: Built-in alert conditions for crossovers and custom prices support sound, email, and app notifications.
Easy setup for real-time trading decisions.
User-Friendly Design: Organized input groups with clear tooltips make configuration intuitive.
Suitable for beginners and advanced traders alike.
Example Use Cases
Swing Trading with MA Crossovers:
Scenario: A trader wants to trade Bitcoin (BTC/USD) on a 4-hour chart using an EMA crossover strategy.
Setup:
Set Moving Average Type to EMA, Length to 20.
Set Moving Average Crossover to “MA vs SMA50”.
Enable Show Buy/Sell Signals and choose “arrowup” for buy, “arrowdown” for sell.
Select “Emerald Spark” for candlestick colors to highlight volume surges.
Usage: Buy when the EMA20 crosses above the SMA50 (green arrow appears) and volume is high (dark green candles). Sell when the EMA20 crosses below the SMA50 (red arrow). Set alerts for real-time notifications.
Scalping with Custom Price Alerts:
Scenario: A day trader monitors Tesla (TSLA) on a 5-minute chart and wants alerts at specific support/resistance levels.
Setup:
Set Custom Buy Alert Price to 150.00 (support) and Custom Sell Alert Price to 160.00 (resistance).
Use “labelup” for buy signals and “labeldown” for sell signals.
Keep Moving Average Crossover as “None” to focus on price alerts.
Usage: Receive a sound alert and label when TSLA crosses 150.00 (buy) or 160.00 (sell). Use volume-colored candles to confirm momentum before entering trades.
When NOT to Use Easy MA Signals
High-Frequency Trading: Reason: The indicator relies on moving averages and volume, which may lag in ultra-fast markets (e.g., sub-second trades). High-frequency traders may need specialized tools with real-time tick data.
Alternative: Use order book or market depth indicators for faster execution.
Low-Volatility or Sideways Markets:
Reason: MA crossovers and custom price alerts can generate false signals in choppy, range-bound markets, leading to whipsaws.
Alternative: Use oscillators like RSI or Bollinger Bands to trade within ranges.
This indicator is tailored more towards less experienced traders. And as always, paper trade until you are comfortable with how this works if you're unfamiliar with trading! We hope you enjoy this and have great success. Thanks for your interested in Easy MA Signals!

ICT Swiftedge# ICT SwiftEdge: Advanced Market Structure Trading System
**Overview**
ICT SwiftEdge is a powerful trading system built upon the foundation of ICTProTools' ICT Breakers, licensed under the Mozilla Public License 2.0 (mozilla.org). This script has been significantly enhanced by to combine market structure analysis with modern technical indicators and a sleek, AI-inspired statistics dashboard. The goal is to provide traders with a comprehensive tool for identifying high-probability trade setups, managing exits, and tracking performance in a visually intuitive way.
**Credits**
This script is a derivative work based on the original "ICT Breakers" by ICTProTools, used with permission under the Mozilla Public License 2.0. Significant enhancements, including RSI-MA signals, trend filtering, dynamic timeframe adjustments, dual exit strategies, and an AI-style statistics dashboard, were developed by . We express our gratitude to ICTProTools for their foundational work in market structure analysis.
**What It Does**
ICT SwiftEdge integrates multiple trading concepts to help traders identify and manage trades based on market structure and momentum:
- **Market Structure Analysis**: Identifies Break of Structure (BOS) and Market Structure Shift (MSS) patterns, which signal potential trend continuations or reversals. BOS indicates a continuation of the current trend, while MSS highlights a shift in market direction, providing key entry points.
- **RSI-MA Signals**: Generates "BUY" and "SELL" signals when BOS or MSS patterns align with the Relative Strength Index (RSI) smoothed by a Moving Average (RSI-MA). Signals are filtered to occur only when RSI-MA is above 50 (for buys) or below 50 (for sells), ensuring momentum supports the trade direction.
- **Trend Filtering**: Prevents multiple signals in the same trend, ensuring only one buy or sell signal per trend direction, reducing noise and improving trade clarity.
- **Dynamic Timeframe Adjustment**: Automatically adjusts pivot points, RSI, and MA parameters based on the selected chart timeframe (1M to 1D), optimizing performance across different market conditions.
- **Flexible Exit Strategies**: Offers two user-selectable exit methods:
- **Trailing Stop-Loss (TSL)**: Exits trades when price moves against the position by a user-defined distance (in points), locking in profits or limiting losses.
- **RSI-MA Exit**: Exits trades when RSI-MA crosses the 50 level, signaling a potential loss of momentum.
- Users can enable either or both strategies, providing flexibility to adapt to different trading styles.
- **AI-Style Statistics Dashboard**: Displays real-time trade performance metrics in a futuristic, neon-colored interface, including total trades, wins, losses, win/loss ratio, and win percentage. This helps traders evaluate the system's effectiveness without external tools.
**Why This Combination?**
The integration of these components creates a synergistic trading system:
- **BOS/MSS and RSI-MA**: Combining market structure breaks with RSI-MA ensures entries are based on both price action (structure) and momentum (RSI-MA), increasing the likelihood of high-probability trades.
- **Trend Filtering**: By limiting signals to one per trend, the system avoids overtrading and focuses on significant market moves.
- **Dynamic Adjustments**: Timeframe-specific parameters make the system versatile, suitable for scalping (1M, 5M) or swing trading (4H, 1D).
- **Dual Exit Strategies**: TSL protects profits during trending markets, while RSI-MA exits are ideal for range-bound or reversing markets, catering to diverse market conditions.
- **Statistics Dashboard**: Provides immediate feedback on trade performance, enabling data-driven decision-making without manual tracking.
This combination balances technical precision with user-friendly visuals, making it accessible to both novice and experienced traders.
**How to Use**
1. **Add to Chart**: Apply the script to any TradingView chart.
2. **Configure Settings**:
- **Chart Timeframe**: Select your chart's timeframe (1M to 1D) to optimize parameters.
- **Structure Timeframe**: Choose a timeframe for market structure analysis (leave blank for chart timeframe).
- **Exit Strategy**: Enable Trailing Stop-Loss (`useTslExit`), RSI-MA Exit (`useRsiMaExit`), or both. Adjust `tslPoints` for TSL distance.
- **Show Signals/Labels**: Toggle `showSignals` and `showExit` to display "BUY", "SELL", and "EXIT" labels.
- **Dashboard**: Enable `showDashboard` to view trade statistics. Customize colors with `dashboardBgColor` and `dashboardTextColor`.
3. **Trading**:
- Look for "BUY" or "SELL" labels to enter trades when BOS/MSS aligns with RSI-MA.
- Exit trades at "EXIT" labels based on your chosen strategy.
- Monitor the statistics dashboard to track performance (total trades, win/loss ratio, win percentage).
4. **Alerts**: Set up alerts for BOS, MSS, buy, sell, or exit signals using the provided alert conditions.
**License**
This script is licensed under the Mozilla Public License 2.0 (mozilla.org). The source code is available for review and modification under the terms of this license.
**Compliance with TradingView House Rules**
This publication adheres to TradingView's House Rules and Scripts Publication Rules. It provides a clear, self-contained description of the script's functionality, credits the original author (ICTProTools), and explains the rationale for combining indicators. The script contains no promotional content, offensive language, or proprietary restrictions beyond MPL 2.0.
**Note**
Trading involves risk, and past performance is not indicative of future results. Always backtest and validate the system on your preferred markets and timeframes before live trading.
Enjoy trading with ICT SwiftEdge, and let data-driven insights guide your decisions!

ENIGMA 369 ENIGMA 369 is a unique Pine Script indicator that combines two complementary trading systems: Break of Structure (BOS) Detection and Session-Based Sniper Signals.
Designed to help traders identify market structure shifts and potential intraday setups, it overlays on the chart to highlight key levels and momentum-driven opportunities. The indicator’s originality lies in its integration of pattern-based BOS analysis (inspired by Smart Money concepts) with time- and trend-filtered Sniper signals, creating a cohesive tool for both swing and intraday trading.
Unlike standalone breakout or scalping indicators, ENIGMA 369 uses:
BOS Logic: A specific two-candle pattern sequence to detect structural shifts, filtered by ATR for significance.
Sniper Logic: Momentum-based signals during high-volatility sessions, optionally aligned with EMA trends.
This synergy allows traders to assess market direction strategically (via BOS) and time entries tactically (via Sniper), all within one indicator.
What It Does
ENIGMA 369 performs two distinct functions:
Break of Structure (BOS) Detection:
Identifies potential support/resistance levels using BullBear (bullish candle followed by bearish) and BearBull (bearish followed by bullish) candle pairs.
Confirms breakouts when price sustains above (bullish) or below (bearish) these levels for a set number of bars.
Draws horizontal lines at confirmed breakout levels, which persist until price crosses a user-defined buffer zone.
Sniper Momentum Signals:
Detects buy/sell setups during user-specified trading sessions (e.g., London/US), based on candle momentum (close relative to midpoint, higher highs/lower lows).
Optionally filters signals with an EMA to align with the broader trend.
Plots lines at the candle’s high/low and 50% wick levels, serving as reference points for entries or stops, removed when price crosses them.
How It Works
ENIGMA 369 relies on price action, market timing, and trend context to generate signals. Here’s how each component operates:
BOS Logic:
Pattern Detection: Scans for two-candle patterns where the first candle is significant (size exceeds an ATR-based threshold) and the second opposes it. For example, a BullBear pair marks the first candle’s high as a potential resistance.
ATR Filter: Uses the Average True Range (default: 14 periods) to ensure the first candle’s range or body is substantial, reducing noise. Users can adjust the ATR multiplier (default: 0.5).
Confirmation: Requires price to close above/below the stored level for a user-defined number of bars (default: 1) to confirm a breakout.
Line Management: Plots green (bullish) or red (bearish) lines at confirmed levels, extending for a set number of bars (default: 10). Lines are deleted if price crosses a buffer (percentage of price or ATR-based, default: 0.1).
Visualization: Optionally highlights pattern candles with transparent green/red backgrounds.
Sniper Logic:
Momentum Signals: Identifies buy signals when a candle closes above its midpoint (high+low)/2 and has a lower low than the prior candle, indicating potential bullish momentum. Sell signals require a close below the midpoint and a higher high.
Session Filter: Limits signals to user-defined London/US session hours (default: 1-23 UTC, adjustable to specific hours like 7-11 UTC for London).
EMA Filter: Optionally uses a 50-period EMA (adjustable) to ensure buy signals occur in uptrends (rising EMA) and sell signals in downtrends (falling EMA).
Line Plotting: Draws blue lines for buy signals (at the low and 50% of the lower wick) and orange lines for sell signals (at the high and 50% of the upper wick). Lines extend right until price crosses them, managed via arrays for efficiency.
Dynamic Removal: Lines are automatically deleted when price breaches them, reflecting changing market conditions.
Why Combine BOS and Sniper?
The integration of BOS and Sniper logic is purposeful and synergistic:
BOS provides a strategic view by identifying structural shifts, helping traders understand the market’s directional bias (e.g., bullish after a confirmed high breakout).
Sniper offers tactical entry points within these trends, focusing on high-volatility sessions where momentum is likely to drive clear moves.
Together, they enable traders to align short-term trades with long-term structure, reducing the risk of trading against the trend. For example, a trader can wait for a bullish BOS confirmation before taking Sniper buy signals, enhancing setup reliability.
This combination is original because it merges Smart Money-inspired BOS detection with a session-based momentum system, a pairing not commonly found in single indicators. It avoids redundant mashups by ensuring each component serves a distinct yet complementary role.
How to Use It
Setup:
Apply ENIGMA 369 to a TradingView chart (Pine Script v5). The chart shown here uses a clean H1 candlestick setup to highlight BOS and Sniper outputs clearly.
Customize settings:
BOS:
ATR Period (default: 14), Min Candle Size (default: 0.5x ATR): Adjust for pattern sensitivity.
Confirmation Bars (default: 1): Set for faster/slower breakouts.
Buffer Type (Percentage/ATR), Buffer Zone Value (default: 0.1): Control line deletion.
Show Lines (default: true), Highlight Candle Pairs (default: false): Enable visuals.
Customize line colors (green/red) and width/length.
Sniper:
London/US Start/End Hours: Set to match your asset’s volatility (e.g., 7-11 UTC for London forex).
EMA Filter (default: true), EMA Period (default: 50): Enable for trend alignment.
Customize line styles (Solid/Dotted/Dashed) and colors (blue/orange) to distinguish from BOS.
Suggested timeframes: H1-H4 for BOS (swing trading), M5-M15 for Sniper (intraday).
Trading with BOS:
Monitor for green (bullish) or red (bearish) lines indicating confirmed breakouts.
Use lines as support/resistance:
Bullish BOS: Consider longs above the line, with stops below the line or buffer.
Bearish BOS: Consider shorts below the line, with stops above the line or buffer.
Line deletion signals a potential reversal or level invalidation.
Trading with Sniper:
Look for blue (buy) or orange (sell) lines during active sessions:
Buy: Enter long at the low or 50% wick line, with stops below the low and targets at resistance.
Sell: Enter short at the high or 50% wick line, with stops above the high and targets at support.
Use EMA filter to avoid counter-trend signals.
Lines disappear when crossed, indicating the setup’s completion or invalidation.
Alerts:
Set alerts for:
“Bullish/Bearish BOS Confirmed” for structural shifts.
“Sniper Buy/Sell Alert” for intraday setups.
Combine with volume, key levels, or news for confirmation.
Best Practices:
Use BOS to confirm trend direction before taking Sniper signals.
Test settings on your asset/timeframe via backtesting.
Apply stop-losses and risk-reward ratios (e.g., 1:2) for discipline.
The chart example shows BOS lines (green/red) and Sniper lines (blue/orange) on an H1 chart, ensuring clarity.
Underlying Concepts
Market Structure (BOS): Identifies turning points where supply/demand shifts, using two-candle patterns to mark significant levels, similar to order block concepts.
Momentum and Timing (Sniper): Targets entries during high-liquidity sessions, using candle midpoint and wick analysis to capture momentum-driven moves.
Trend Context: EMA ensures signals align with the market’s direction, reducing false positives.
Price Action: Both systems rely on raw price behavior, avoiding lagging oscillators for timely signals.
Limitations
BOS may lag in fast markets; reduce confirmation bars for scalping.
Sniper signals depend on session settings; ensure alignment with your asset’s volatility.
Multiple lines may clutter charts; adjust colors/styles for clarity.
Not a standalone system; combine with other analysis for best results.
Disclaimer
ENIGMA 369 is a tool to identify potential trading setups, not a guaranteed profit system. Past performance does not predict future results. Backtest thoroughly and use with proper risk management.
Conclusion
ENIGMA 369 offers a structured approach to trading by combining BOS’s structural insights with Sniper’s precise, session-based entries. Its unique integration makes it suitable for traders seeking to align strategic and tactical decisions. Customize it to your style, test it rigorously, and use it to enhance your market analysis.

Aurora Flow Oscillator [QuantAlgo]The Aurora Flow Oscillator is an advanced momentum-based technical indicator designed to identify market direction, momentum shifts, and potential reversal zones using adaptive filtering techniques. It visualizes price momentum through a dynamic oscillator that quantifies trend strength and direction, helping traders and investors recognize momentum shifts and trading opportunities across various timeframes and asset class.
🟢 Technical Foundation
The Aurora Flow Oscillator employs a sophisticated mathematical approach with adaptive momentum filtering to analyze market conditions, including:
Price-Based Momentum Calculation: Calculates logarithmic price changes to measure the rate and magnitude of market movement
Adaptive Momentum Filtering: Applies an advanced filtering algorithm to smooth momentum calculations while preserving important signals
Acceleration Analysis: Incorporates momentum acceleration to identify shifts in market direction before they become obvious
Signal Normalization: Automatically scales the oscillator output to a range between -100 and 100 for consistent interpretation across different market conditions
The indicator processes price data through multiple filtering stages, applying mathematical principles including exponential smoothing with adaptive coefficients. This creates an oscillator that dynamically adjusts to market volatility while maintaining responsiveness to genuine trend changes.
🟢 Key Features & Signals
1. Momentum Flow and Extreme Zone Identification
The oscillator presents market momentum through an intuitive visual display that clearly indicates both direction and strength:
Above Zero: Indicates positive momentum and potential bullish conditions
Below Zero: Indicates negative momentum and potential bearish conditions
Slope Direction: The angle and direction of the oscillator provide immediate insight into momentum strength
Zero Line Crossings: Signal potential trend changes and new directional momentum
The indicator also identifies potential overbought and oversold market conditions through extreme zone markings:
Upper Zone (>50): Indicates strong bullish momentum that may be approaching exhaustion
Lower Zone (<-50): Indicates strong bearish momentum that may be approaching exhaustion
Extreme Boundaries (±95): Mark potentially unsustainable momentum levels where reversals become increasingly likely
These zones are displayed with gradient intensity that increases as the oscillator moves toward extremes, helping traders and investors:
→ Identify potential reversal zones
→ Determine appropriate entry and exit points
→ Gauge overall market sentiment strength
2. Customizable Trading Style Presets
The Aurora Flow Oscillator offers pre-configured settings for different trading approaches:
Default (80,150): Balanced configuration suitable for most trading and investing situations.
Scalping (5,80): Highly responsive settings for ultra-short-term trades. Generates frequent signals and catches quick price movements. Best for 1-15min charts when making many trades per day.
Day Trading (8,120): Optimized for intraday movements with faster response than default settings while maintaining reasonable signal quality. Ideal for 5-60min or 4h-12h timeframes.
Swing Trading (10,200): Designed for multi-day positions with stronger noise filtering. Focuses on capturing larger price swings while avoiding minor fluctuations. Works best on 1-4h and daily charts.
Position Trading (14,250): For longer-term position traders/investors seeking significant market trends. Reduces false signals by heavily filtering market noise. Ideal for daily or even weekly charts.
Trend Following (16,300): Maximum smoothing that prioritizes established directional movements over short-term fluctuations. Best used on daily and weekly charts, but can also be used for lower timeframe trading.
Countertrend (7,100): Tuned to detect potential reversals and exhaustion points in trends. More sensitive to momentum shifts than other presets. Effective on 15min-4h charts, as well as daily and weekly charts.
Each preset automatically adjusts internal parameters for optimal performance in the selected trading context, providing flexibility across different market approaches without requiring complex manual configuration.
🟢 Practical Usage Tips
1/ Trend Analysis and Interpretation
→ Direction Assessment: Evaluate the oscillator's position relative to zero to determine underlying momentum bias
→ Momentum Strength: Measure the oscillator's distance from zero within the -100 to +100 range to quantify momentum magnitude
→ Trend Consistency: Monitor the oscillator's path for sustained directional movement without frequent zero-line crossings
→ Reversal Detection: Watch for oscillator divergence from price and deceleration of movement when approaching extreme zones
2/ Signal Generation Strategies
Depending on your trading approach, multiple signal strategies can be employed:
Trend Following Signals:
Enter long positions when the oscillator crosses above zero
Enter short positions when the oscillator crosses below zero
Add to positions on pullbacks while maintaining the overall trend direction
Countertrend Signals:
Look for potential reversals when the oscillator reaches extreme zones (±95)
Enter contrary positions when momentum shows signs of exhaustion
Use oscillator divergence with price as additional confirmation
Momentum Shift Signals:
Enter positions when oscillator changes direction after establishing a trend
Exit positions when oscillator direction reverses against your position
Scale position size based on oscillator strength percentage
3/ Timeframe Optimization
The indicator can be effectively applied across different timeframes with these considerations:
Lower Timeframes (1-15min):
Use Scalping or Day Trading presets
Focus on quick momentum shifts and zero-line crossings
Be cautious of noise in extreme market conditions
Medium Timeframes (30min-4h):
Use Default or Swing Trading presets
Look for established trends and potential reversal zones
Combine with support/resistance analysis for entry/exit precision
Higher Timeframes (Daily+):
Use Position Trading or Trend Following presets
Focus on major trend identification and long-term positioning
Use extreme zones for position management rather than immediate reversals
🟢 Pro Tips
Price Momentum Period:
→ Lower values (5-7) increase sensitivity to minor price fluctuations but capture more market noise
→ Higher values (10-16) emphasize sustained momentum shifts at the cost of delayed response
→ Adjust based on your timeframe (lower for shorter timeframes, higher for longer timeframes)
Oscillator Filter Period:
→ Lower values (80-120) produce more frequent directional changes and earlier response to momentum shifts
→ Higher values (200-300) filter out shorter-term fluctuations to highlight dominant market cycles
→ Match to your typical holding period (shorter holding time = lower filter values)
Multi-Timeframe Analysis:
→ Compare oscillator readings across different timeframes for confluence
→ Look for alignment between higher and lower timeframe signals
→ Use higher timeframe for trend direction, lower for earlier entries
Volatility-Adaptive Trading:
→ Use oscillator strength to adjust position sizing (stronger = larger)
→ Consider reducing exposure when oscillator reaches extreme zones
→ Implement tighter stops during periods of oscillator acceleration
Combination Strategies:
→ Pair with volume indicators for confirmation of momentum shifts
→ Use with support/resistance levels for strategic entry and exit points
→ Combine with volatility indicators for comprehensive market context
